

Question: Only need help with Question 4! Use R language thanks! Q3: Consider a linear model defined by the function below, where a is a model
Only need help with Question 4!
Use R language
thanks!
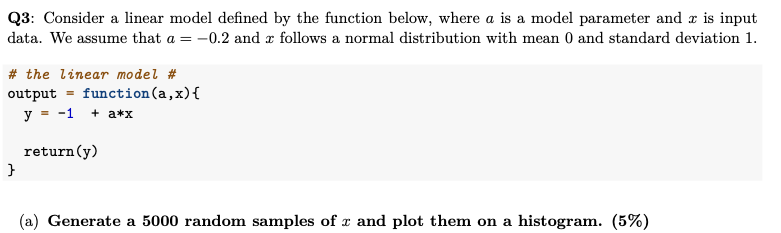
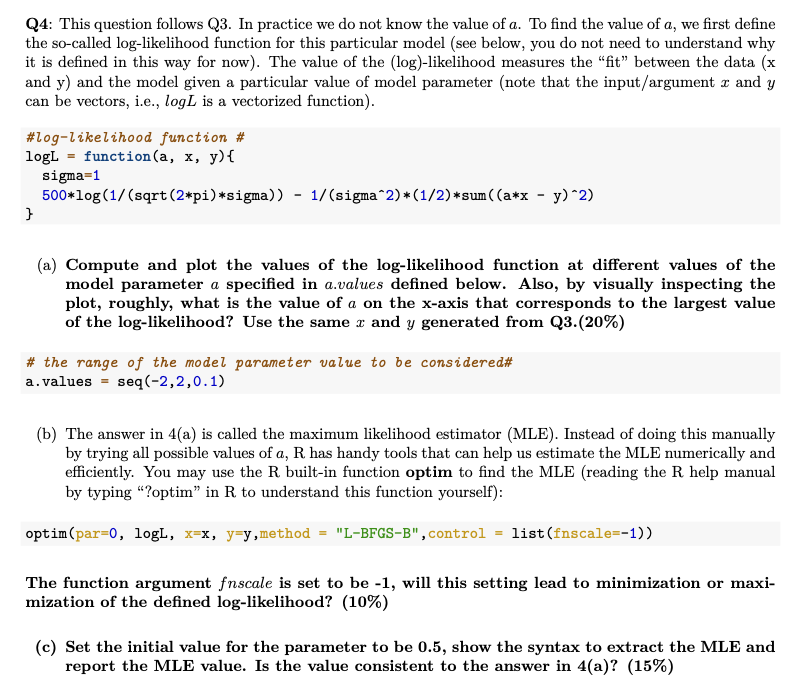
Q3: Consider a linear model defined by the function below, where a is a model parameter and x is input data. We assume that a=0.2 and x follows a normal distribution with mean 0 and standard deviation 1 . \# the linear model \# output = function (a,x){ y=1+ax return(y) \} (a) Generate a 5000 random samples of x and plot them on a histogram. (5\%) Q4: This question follows Q3. In practice we do not know the value of a. To find the value of a, we first define the so-called log-likelihood function for this particular model (see below, you do not need to understand why it is defined in this way for now). The value of the (log)-likelihood measures the "fit" between the data (x and y ) and the model given a particular value of model parameter (note that the input/argument x and y can be vectors, i.e., logL is a vectorized function). \#log-likelihood function \# logL= function (a,x,y){ sigma =1 500log(1/(sqrt(2pi)sigma))1/(sigma2)(1/2)sum((axy)2) \} (a) Compute and plot the values of the log-likelihood function at different values of the model parameter a specified in a.values defined below. Also, by visually inspecting the plot, roughly, what is the value of a on the x-axis that corresponds to the largest value of the log-likelihood? Use the same x and y generated from Q3.(20\%) \# the range of the model parameter value to be considered\# a. values =seq(2,2,0.1) (b) The answer in 4(a) is called the maximum likelihood estimator (MLE). Instead of doing this manually by trying all possible values of a,R has handy tools that can help us estimate the MLE numerically and efficiently. You may use the R built-in function optim to find the MLE (reading the R help manual by typing "?optim" in R to understand this function yourself): optim (par=0, logL, x=x,y=y, method = "L-BFGS-B", control = list(fnscale=-1)) The function argument fnscale is set to be 1, will this setting lead to minimization or maximization of the defined log-likelihood? (10\%) (c) Set the initial value for the parameter to be 0.5, show the syntax to extract the MLE and report the MLE value. Is the value consistent to the answer in 4(a) ? (15\%)
Step by Step Solution
There are 3 Steps involved in it

Get step-by-step solutions from verified subject matter experts