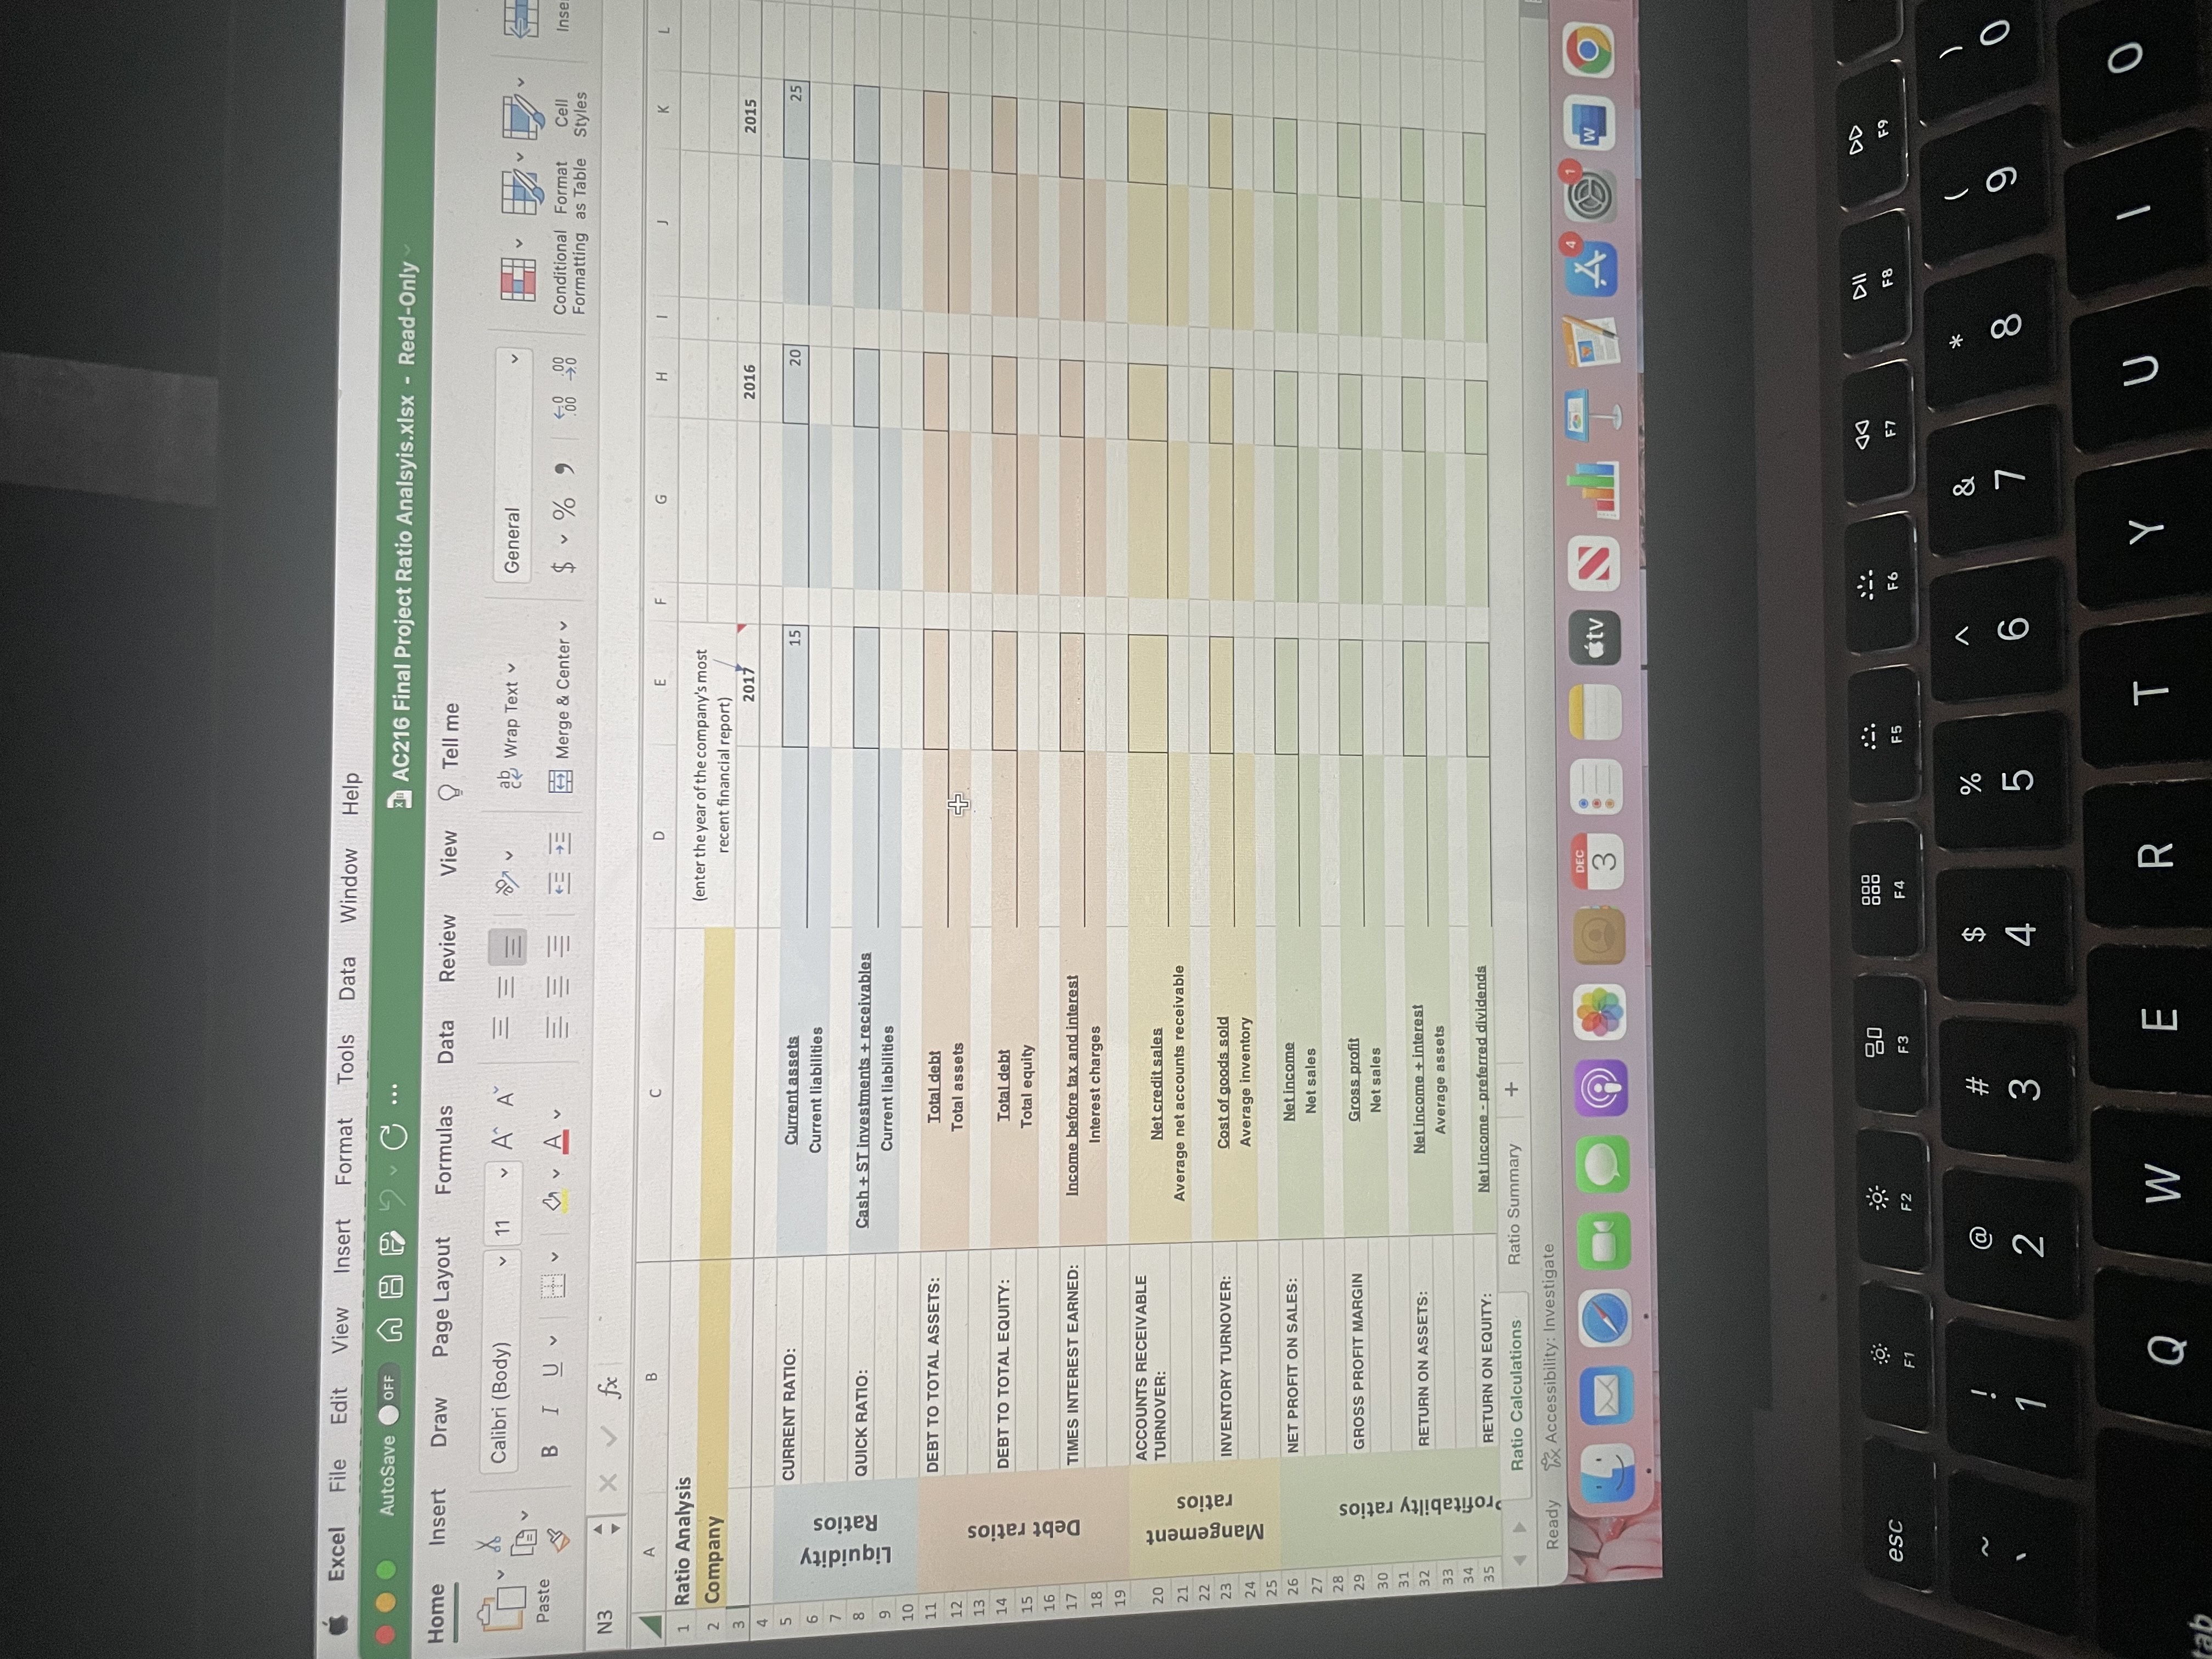
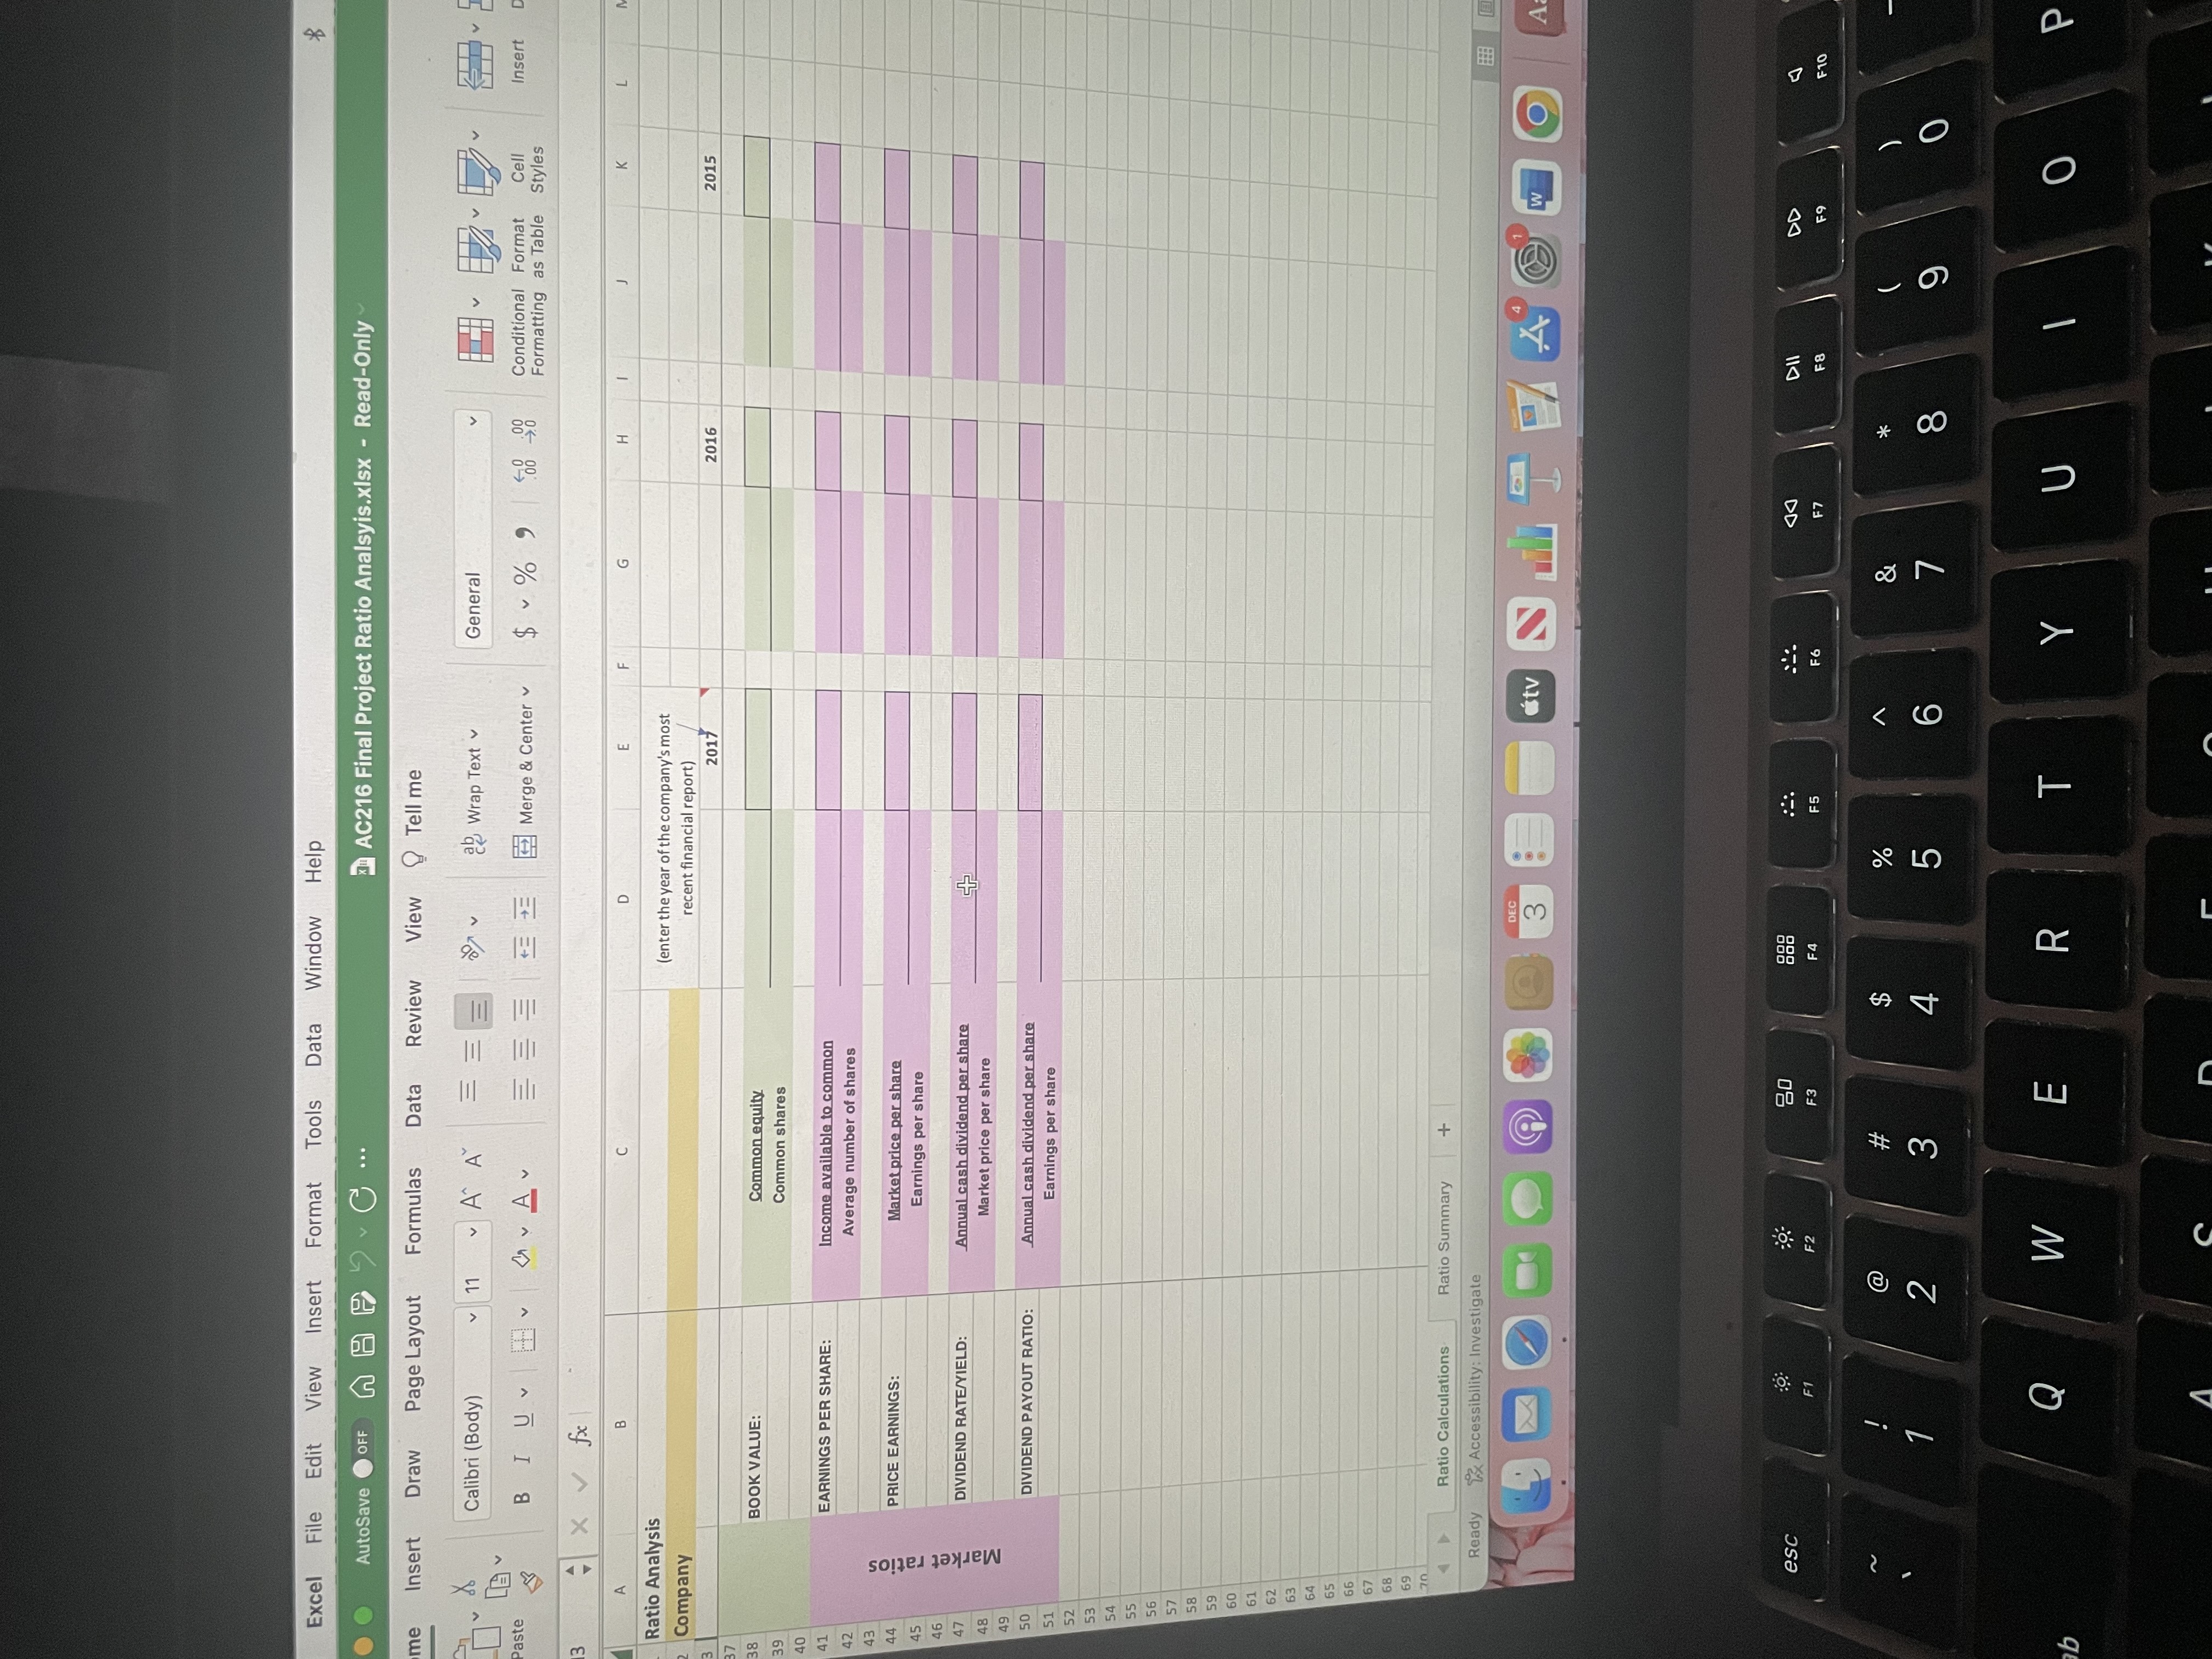
Question
Only need the year 2022 for Target company. DISREGARD THE OUTDATED DATES ON THE EXCEL FORM. U.S. Securities and Exchange Commissior (n.d.). Edgar filing documents
Only need the year 2022 for Target company. DISREGARD THE OUTDATED DATES ON THE EXCEL FORM.
U.S. Securities and Exchange Commissior (n.d.). Edgar filing documents for 0000027419-21-000010. https://www.sec.gov/Archives/edgar/data/27419/000002741921000010/0000027419-21-000010-index.html
Inline XBRL Viewer. (n.d.). UNITED STATES SECURITIES AND EXCHANGE COMMISSIONhttps://www.sec.gov/ix?doc=%2FArchives%2Fedgar%2Fdata%2F0000027419%2F000002741921000010%2Ftgt-20210130.htm
Tsla-10k_20191231.HTM. (n.d.). FORM 10-Khttps://www.sec.gov/Archives/edgar/data/1318605/000156459020004475/tsla-10k_20191231.htm
Yahoo! (2022, December 4). Target corporation (TGT) stock historical prices & data. Yahoo! Finance. https://finance.yahoo.com/quote/TGT/history?period1=1512345600&period2=1670025600&interval=1mo&filter=history&frequency=1mo&includeAdjustedClose=true


Excel File Edit View Insert Format Tools Data Window Help AutoSave OFF AC216 Final Project Ratio Analsyis.xlsx - Read-Only Home Insert Draw Page Layout Formulas Data Review View Tell me X Calibri (Body) V 11 A A ab ab Wrap Text General Paste BIUV V V Merge & Center V $ % 9 0.00 .000 N3 X fx A B 1 Ratio Analysis 2 Company 3 4 5 67 8 9 10 11 12 13 14 15 16 17 18 567 19 20 21 22 23 24 25 26 27 28 29 30 31 32 33 34 33 35 Mangement ratios Debt ratios Liquidity Ratios CURRENT RATIO: QUICK RATIO: DEBT TO TOTAL ASSETS: DEBT TO TOTAL EQUITY: TIMES INTEREST EARNED: Current assets Current liabilities Cash + ST investments + receivables Current liabilities Total debt Total assets Total debt Total equity Income before tax and interest Interest charges ACCOUNTS RECEIVABLE TURNOVER: INVENTORY TURNOVER: NET PROFIT ON SALES: Net credit sales Average net accounts receivable Cost of goods sold Average inventory Net income Net sales Profitabilty ratios Ready GROSS PROFIT MARGIN RETURN ON ASSETS: RETURN ON EQUITY: Ratio Calculations Gross profit Net sales Net income + interest Average assets Net income-preferred dividends Ratio Summary + Accessibility: Investigate O esc F1 1 ! F2 80 000 DOO F3 F4 12 @ # $ 59 3 3 4 D E (enter the year of the company's most recent financial report) + 2017 15 V V V Cell Conditional Format Formatting as Table Styles G H J K 2016 20 DEC 3
Step by Step Solution
There are 3 Steps involved in it
Step: 1

Get Instant Access to Expert-Tailored Solutions
See step-by-step solutions with expert insights and AI powered tools for academic success
Step: 2

Step: 3

Ace Your Homework with AI
Get the answers you need in no time with our AI-driven, step-by-step assistance
Get Started


