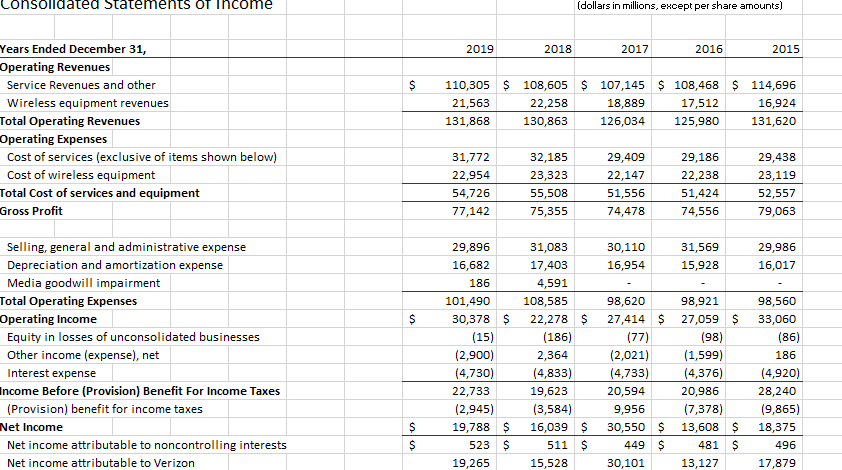
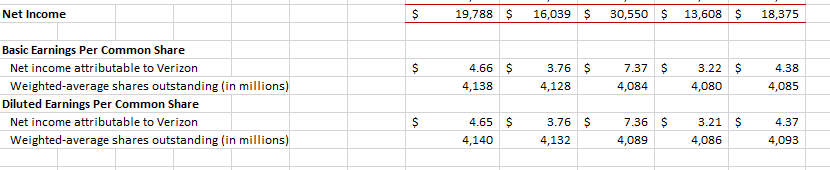
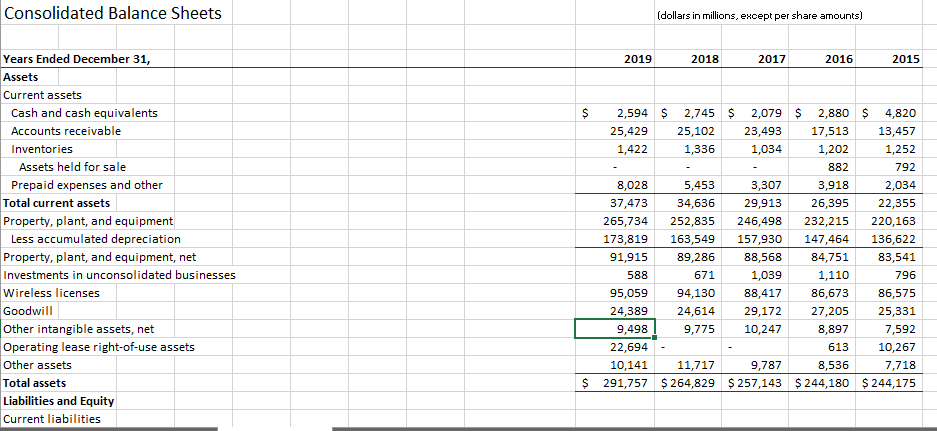
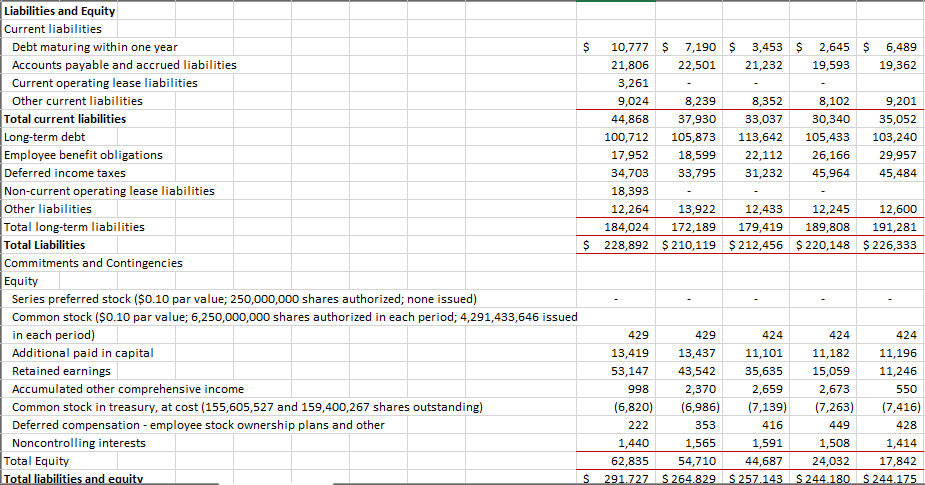

onsolidated Statements of Thcome (dollars in millions, except per share amounts) 2019 2018 2017 2016 2015 $ 110,305 $ 108,605 $ 107,145 $ 108,468 $ 114,696 21,563 22,258 18,889 17,512 16,924 131,868 130,863 126,034 125,980 131,620 Years Ended December 31, Operating Revenues Service Revenues and other Wireless equipment revenues Total Operating Revenues Operating Expenses Cost of services (exclusive of items shown below) Cost of wireless equipment Total Cost of services and equipment Gross Profit 31,772 22,954 54,726 77,142 32,185 23,323 55,508 75,355 29,409 22,147 51,556 74,478 29,186 22,238 51,424 74,556 29,438 23,119 52,557 79,063 30,110 16,954 31,569 15,928 29,986 16,017 $ Selling, general and administrative expense Depreciation and amortization expense Media goodwill impairment Total Operating Expenses Operating Income Equity in losses of unconsolidated businesses Other income (expense), net Interest expense Income Before (Provision) Benefit For Income Taxes (Provision) benefit for income taxes Net Income Net income attributable to noncontrolling interests Net income attributable to Verizon 29,896 16,682 186 101,490 30,378 $ (15) (2,900) (4,730) 22,733 (2,945) 19,788 $ 523 $ 19,265 31,083 17,403 4,591 108,585 22,278 $ (186) 2,364 (4,833) 19,623 (3,584) 16,039 $ 511 $ 15,528 98,620 27,414 $ (77) (2,021) (4,733) 20,594 9,956 30,550 $ 449 $ 30,101 98,921 27,059 $ (98) (1,599) (4,376) 20,986 (7,378) 13,608 $ 481 S 13,127 98,560 33,060 (86) 186 (4,920) 28,240 (9,865) 18,375 496 17,879 $ $ Net Income $ 19,788 $ 16,039 $ 30,550 $ 13,608 $ 18,375 $ 4.66 $ 4,138 3.76 $ 4,128 7.37 $ 4,084 3.22 $ 4,080 4.38 4,085 Basic Earnings Per Common Share Net income attributable to Verizon Weighted average shares outstanding (in millions) Diluted Earnings Per Common Share Net income attributable to Verizon Weighted-average shares outstanding (in millions) $ 4.37 4.65 $ 4,140 3.76 $ 4,132 7.36 $ 4,089 3.21 $ 4,086 4,093 Consolidated Balance Sheets (dollars in millions, except per share amounts) 2019 2018 2017 2016 2015 $ Years Ended December 31, Assets Current assets Cash and cash equivalents Accounts receivable Inventories Assets held for sale Prepaid expenses and other Total current assets Property, plant, and equipment Less accumulated depreciation Property, plant, and equipment, net Investments in unconsolidated businesses Wireless licenses Goodwill Other intangible assets, net Operating lease right-of-use assets Other assets Total assets Liabilities and Equity Current liabilities 2,594 $ 2,745 $ 2,079 $ 2,880 $ 4,820 25,429 25,102 23,493 17,513 13,457 1,422 1,336 1,034 1,202 1,252 882 792 8,028 5,453 3,307 3,918 2,034 37,473 34,636 29,913 26,395 22,355 265,734 252,835 246,498 232,215 220,163 173,819 163,549 157,930 147,464 136,622 91,915 89,286 88,568 84,751 83,541 588 671 1,039 1,110 796 95,059 94,130 88,417 86,673 86,575 24,389 24,614 29,172 27,205 25,331 9,498 9,775 10,247 8,897 7,592 22,694 613 10,267 10,141 11,717 9,787 8,536 7,718 291,757 $ 264,829 $ 257,143 $ 244,180 $ 244,175 $ Liabilities and Equity Current liabilities Debt maturing within one year S 10,777 $ 7,190 S 3,453 $ 2,645 S 6,489 Accounts payable and accrued liabilities 21,806 22,501 21,232 19,593 19,362 Current operating lease liabilities 3,261 Other current liabilities 9,024 8,239 8,352 8,102 9,201 Total current liabilities 44,868 37,930 33,037 30,340 35,052 Long-term debt 100,712 105,873 113,642 105,433 103,240 Employee benefit obligations 17,952 18,599 22,112 26,166 29,957 Deferred income taxes 34,703 33,795 31,232 45,964 45,484 Non-current operating lease liabilities 18,393 Other liabilities 12,264 13,922 12,433 12,245 12,600 Total long-term liabilities 184,024 172,189 179,419 189,808 191,281 Total Liabilities $ 228,892 $ 210,119 $ 212,456 $ 220,148 $ 226,333 Commitments and contingencies Equity Series preferred stock ($0.10 par value; 250,000,000 shares authorized; none issued) Common stock ($0.10 par value; 6,250,000,000 shares authorized in each period; 4,291,433,646 issued in each period) 429 429 424 424 424 Additional paid in capital 13,419 13,437 11,101 11,182 11,196 Retained earnings 53,147 43,542 35,635 15,059 11,246 Accumulated other comprehensive income 998 2,370 2,659 2,673 550 Common stock in treasury, at cost (155,605,527 and 159,400,267 shares outstanding) (6,820) (6,986) (7,139) (7,263) (7,416) Deferred compensation - employee stock ownership plans and other 222 353 416 449 428 Noncontrolling interests 1,440 1,565 1,591 1,508 1,414 Total Equity 62,835 54,710 44,687 24,032 17,842 Total liabilities and equity S 291.727 S 264.829 $ 257.143 S 244.180 $ 244 175 Summarizing the firm's situation (on assets (cash, receivables, inventories, fixed assets), debt, equity, sales, etc..): What are the strengths and weaknesses? (???)