Answered step by step
Verified Expert Solution
Link Copied!

Question

1 Approved Answer

Open the spreadsheet Excel_7. Create a pivot table using the data on the Pivot Table Data sheet. The pivot table should show monthly sales based
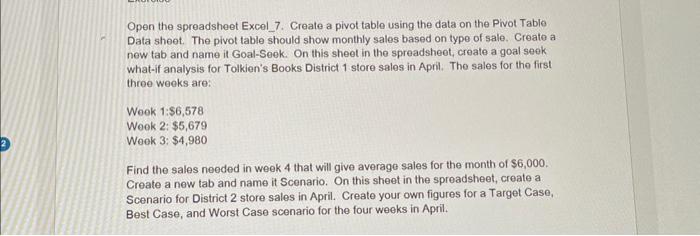
image text in transcribed
Open the spreadsheet Excel_7. Create a pivot table using the data on the Pivot Table Data sheet. The pivot table should show monthly sales based on type of sale. Greate a new tab and name it Goal-Seek. On this sheet in the spreadsheet, create a goal seek what-if analysis for Tolkien's Books District 1 store sales in April. The sales for the first three weeks are: Weok 1:$6,578 Weok 2: $5,679 Weok 3: $4,980 Find the sales needed in week 4 that will give average sales for the month of $6,000. Create a new tab and name it Scenario. On this sheet in the spreadsheet, create a Scenario for District 2 store sales in April. Create your own figures for a Target Case, Best Case, and Worst Case scenario for the four weeks in April

Step by Step Solution

There are 3 Steps involved in it

Step: 1

blur-text-image

Get Instant Access to Expert-Tailored Solutions

See step-by-step solutions with expert insights and AI powered tools for academic success

Step: 2

blur-text-image_2

Step: 3

blur-text-image_3

Ace Your Homework with AI

Get the answers you need in no time with our AI-driven, step-by-step assistance

Get Started

Recommended Textbook for

Emile Woolf On Audit Exemption

Authors: Emile Woolf

1st Edition

0863253911, 978-0863253911

More Books

Students also viewed these Accounting questions

Question

2. Use and interpret analysis of variance tests

Answered: 1 week ago