Question: Optimal Portfolio Choice Please help me in this project (specially last 2 steps 14,15) for these 10 stocks (APPL, FB, ADBE, ORCL, AMZN, INTC, CSCO,
Optimal Portfolio Choice
Please help me in this project (specially last 2 steps 14,15) for these 10 stocks
(APPL, FB, ADBE, ORCL, AMZN, INTC, CSCO, CHMA, GOOGL, MSFT)


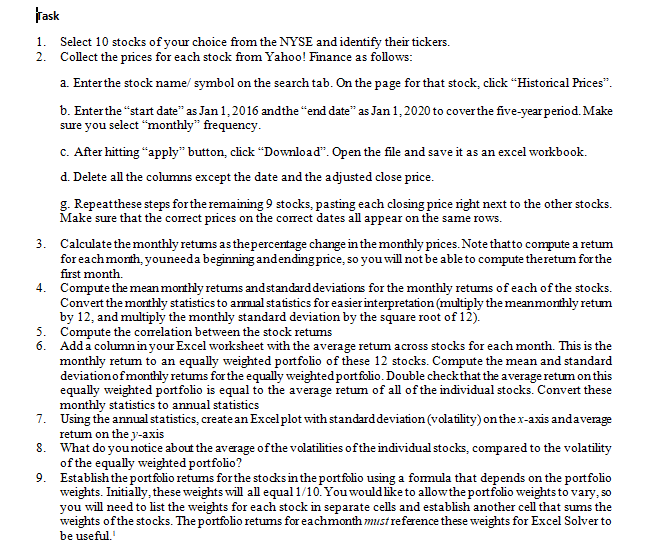
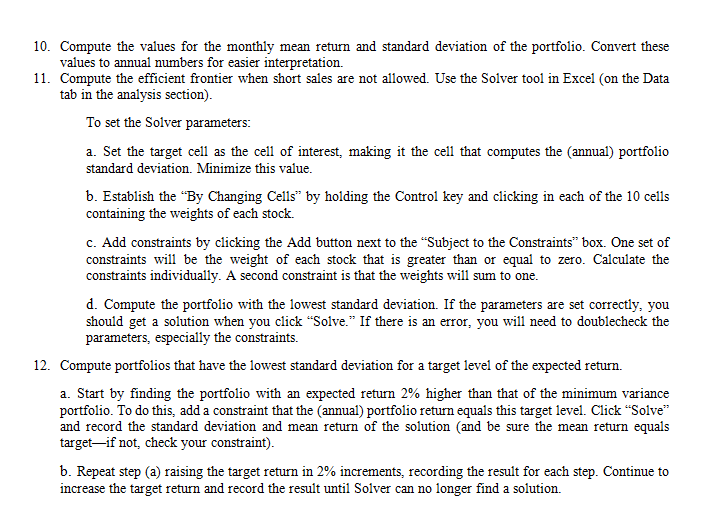
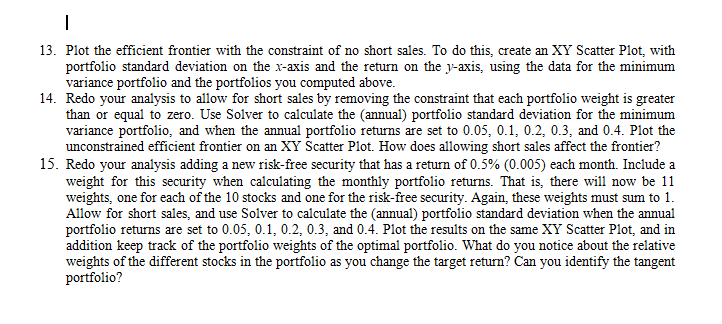
Task 1. Select 10 stocks of your choice from the NYSE and identify their tickers. 2. Collect the prices for each stock from Yahoo! Finance as follows: a. Enter the stock name symbol on the search tab. On the page for that stock click Historical Prices. b. Enterthe start date as Jan 1, 2016 andthe "end date as Jan 1, 2020 to cover the five-year period. Make sure you select "monthly" frequency. C. After hitting "apply" button, click Download. Open the file and save it as an excel workbook. d. Delete all the columns except the date and the adjusted close price. g. Repeatthese steps for the remaining 9 stocks, pasting each closing price right next to the other stocks. Make sure that the correct prices on the correct dates all appear on the same rows. 3. Calculate the monthly retums as the percentage change in the monthly prices. Note thatto conpute a retum foreach month, youneeda beginning and ending price, so you will not be able to compute theretum for the first month. 4. Compute the mean monthly retums andstandard deviations for the monthly retums of each of the stocks. Convert the monthly statistics to amual statistics for easier interpretation (multiply the meanmonthly retum by 12, and multiply the monthly standard deviation by the square root of 12). 5. Compute the correlation between the stock retums 6. Add a column in your Excel worksheet with the average retum across stocks for each month. This is the monthly retum to an equally weighted portfolio of these 12 stocks. Compute the mean and standard deviation of monthly retums for the equally weighted portfolio Double checkthat the average retum on this equally weighted portfolio is equal to the average retum of all of the individual stocks. Convert these monthly statistics to annual statistics 7. Using the annual statistics, create an Excel plot with standard deviation (volatility) on the x-axis andaverage retum on the y-axis What do you notice about the average of the volatilities of the individual stocks, compared to the volatility of the equally weighted portfolio? 9. Establish the portfolio retums for the stocks in the portfolio using a fomula that depends on the portfolio weights. Initially, these weights will all equal1/10. You would like to allow the portfolio weights to vary, so you will need to list the weights for each stock in separate cells and establish another cell that sums the weights of the stocks. The portfolio retums for eachmonth must reference these weights for Excel Solver to be useful 8. 10. Compute the values for the monthly mean return and standard deviation of the portfolio. Convert these values to annual numbers for easier interpretation. 11. Compute the efficient frontier when short sales are not allowed. Use the Solver tool in Excel (on the Data tab in the analysis section). To set the Solver parameters: a. Set the target cell as the cell of interest, making it the cell that computes the annual) portfolio standard deviation. Minimize this value. b. Establish the By Changing Cells by holding the Control key and clicking in each of the 10 cells containing the weights of each stock. C. Add constraints by clicking the Add button next to the "Subject to the Constraints box. One set of constraints will be the weight of each stock that is greater than or equal to zero. Calculate the constraints individually. A second constraint is that the weights will sum to one. d. Compute the portfolio with the lowest standard deviation. If the parameters are set correctly, you should get a solution when you click "Solve." If there is an error, you will need to doublecheck the parameters, especially the constraints. 12. Compute portfolios that have the lowest standard deviation for a target level of the expected return. a. Start by finding the portfolio with an expected return 2% higher than that of the minimum variance portfolio. To do this, add a constraint that the annual) portfolio return equals this target level. Click "Solve" and record the standard deviation and mean return of the solution (and be sure the mean return equals targetif not check your constraint). b. Repeat step (a) raising the target return in 2% increments, recording the result for each step. Continue to increase the target return and record the result until Solver can no longer find a solution. I 13. Plot the efficient frontier with the constraint of no short sales. To do this, create an XY Scatter Plot, with portfolio standard deviation on the x-axis and the return on the y-axis, using the data for the minimum variance portfolio and the portfolios you computed above. 14. Redo your analysis to allow for short sales by removing the constraint that each portfolio weight is greater than or equal to zero. Use Solver to calculate the annual) portfolio standard deviation for the minimum variance portfolio, and when the annual portfolio returns are set to 0.05, 0.1, 0.2, 0.3, and 0.4. Plot the unconstrained efficient frontier on an XY Scatter Plot. How does allowing short sales affect the frontier? 15. Redo your analysis adding a new risk-free security that has a return of 0.5% (0.005) each month. Include a weight for this security when calculating the monthly portfolio returns. That is, there will now be 11 weights, one for each of the 10 stocks and one for the risk-free security. Again, these weights must sum to 1. Allow for short sales, and use Solver to calculate the annual) portfolio standard deviation when the annual portfolio returns are set to 0.05, 0.1, 0.2, 0.3, and 0.4. Plot the results on the same XY Scatter Plot, and in addition keep track of the portfolio weights of the optimal portfolio. What do you notice about the relative weights of the different stocks in the portfolio as you change the target return? Can you identify the tangent portfolio? Task 1. Select 10 stocks of your choice from the NYSE and identify their tickers. 2. Collect the prices for each stock from Yahoo! Finance as follows: a. Enter the stock name symbol on the search tab. On the page for that stock click Historical Prices. b. Enterthe start date as Jan 1, 2016 andthe "end date as Jan 1, 2020 to cover the five-year period. Make sure you select "monthly" frequency. C. After hitting "apply" button, click Download. Open the file and save it as an excel workbook. d. Delete all the columns except the date and the adjusted close price. g. Repeatthese steps for the remaining 9 stocks, pasting each closing price right next to the other stocks. Make sure that the correct prices on the correct dates all appear on the same rows. 3. Calculate the monthly retums as the percentage change in the monthly prices. Note thatto conpute a retum foreach month, youneeda beginning and ending price, so you will not be able to compute theretum for the first month. 4. Compute the mean monthly retums andstandard deviations for the monthly retums of each of the stocks. Convert the monthly statistics to amual statistics for easier interpretation (multiply the meanmonthly retum by 12, and multiply the monthly standard deviation by the square root of 12). 5. Compute the correlation between the stock retums 6. Add a column in your Excel worksheet with the average retum across stocks for each month. This is the monthly retum to an equally weighted portfolio of these 12 stocks. Compute the mean and standard deviation of monthly retums for the equally weighted portfolio Double checkthat the average retum on this equally weighted portfolio is equal to the average retum of all of the individual stocks. Convert these monthly statistics to annual statistics 7. Using the annual statistics, create an Excel plot with standard deviation (volatility) on the x-axis andaverage retum on the y-axis What do you notice about the average of the volatilities of the individual stocks, compared to the volatility of the equally weighted portfolio? 9. Establish the portfolio retums for the stocks in the portfolio using a fomula that depends on the portfolio weights. Initially, these weights will all equal1/10. You would like to allow the portfolio weights to vary, so you will need to list the weights for each stock in separate cells and establish another cell that sums the weights of the stocks. The portfolio retums for eachmonth must reference these weights for Excel Solver to be useful 8. 10. Compute the values for the monthly mean return and standard deviation of the portfolio. Convert these values to annual numbers for easier interpretation. 11. Compute the efficient frontier when short sales are not allowed. Use the Solver tool in Excel (on the Data tab in the analysis section). To set the Solver parameters: a. Set the target cell as the cell of interest, making it the cell that computes the annual) portfolio standard deviation. Minimize this value. b. Establish the By Changing Cells by holding the Control key and clicking in each of the 10 cells containing the weights of each stock. C. Add constraints by clicking the Add button next to the "Subject to the Constraints box. One set of constraints will be the weight of each stock that is greater than or equal to zero. Calculate the constraints individually. A second constraint is that the weights will sum to one. d. Compute the portfolio with the lowest standard deviation. If the parameters are set correctly, you should get a solution when you click "Solve." If there is an error, you will need to doublecheck the parameters, especially the constraints. 12. Compute portfolios that have the lowest standard deviation for a target level of the expected return. a. Start by finding the portfolio with an expected return 2% higher than that of the minimum variance portfolio. To do this, add a constraint that the annual) portfolio return equals this target level. Click "Solve" and record the standard deviation and mean return of the solution (and be sure the mean return equals targetif not check your constraint). b. Repeat step (a) raising the target return in 2% increments, recording the result for each step. Continue to increase the target return and record the result until Solver can no longer find a solution. I 13. Plot the efficient frontier with the constraint of no short sales. To do this, create an XY Scatter Plot, with portfolio standard deviation on the x-axis and the return on the y-axis, using the data for the minimum variance portfolio and the portfolios you computed above. 14. Redo your analysis to allow for short sales by removing the constraint that each portfolio weight is greater than or equal to zero. Use Solver to calculate the annual) portfolio standard deviation for the minimum variance portfolio, and when the annual portfolio returns are set to 0.05, 0.1, 0.2, 0.3, and 0.4. Plot the unconstrained efficient frontier on an XY Scatter Plot. How does allowing short sales affect the frontier? 15. Redo your analysis adding a new risk-free security that has a return of 0.5% (0.005) each month. Include a weight for this security when calculating the monthly portfolio returns. That is, there will now be 11 weights, one for each of the 10 stocks and one for the risk-free security. Again, these weights must sum to 1. Allow for short sales, and use Solver to calculate the annual) portfolio standard deviation when the annual portfolio returns are set to 0.05, 0.1, 0.2, 0.3, and 0.4. Plot the results on the same XY Scatter Plot, and in addition keep track of the portfolio weights of the optimal portfolio. What do you notice about the relative weights of the different stocks in the portfolio as you change the target return? Can you identify the tangent portfolio
Step by Step Solution
There are 3 Steps involved in it

Get step-by-step solutions from verified subject matter experts


