

Question
Option #1: Corporate Finance Application Part A: Ratio Analysis (Week 3 Milestone) Attached are the financial statements for Smith Company, Inc. Use the financial statements
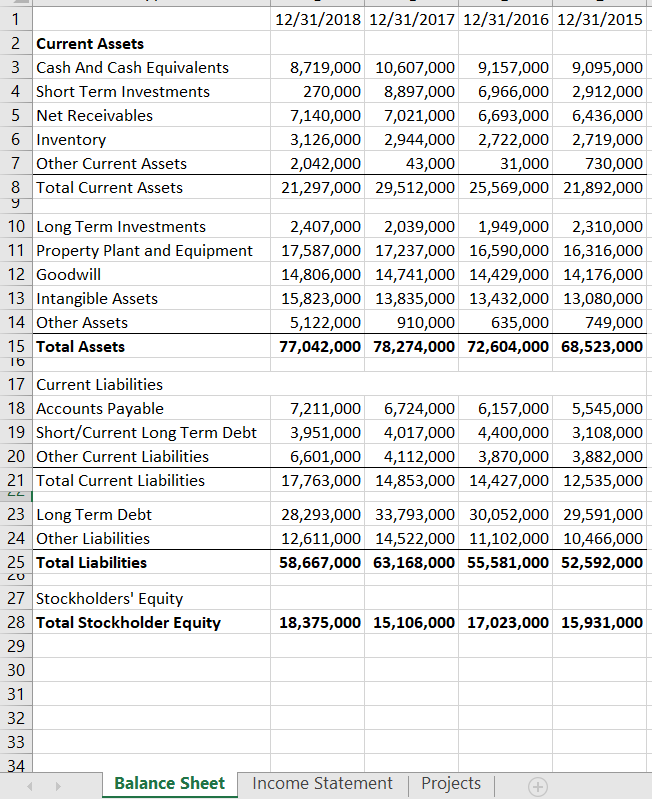
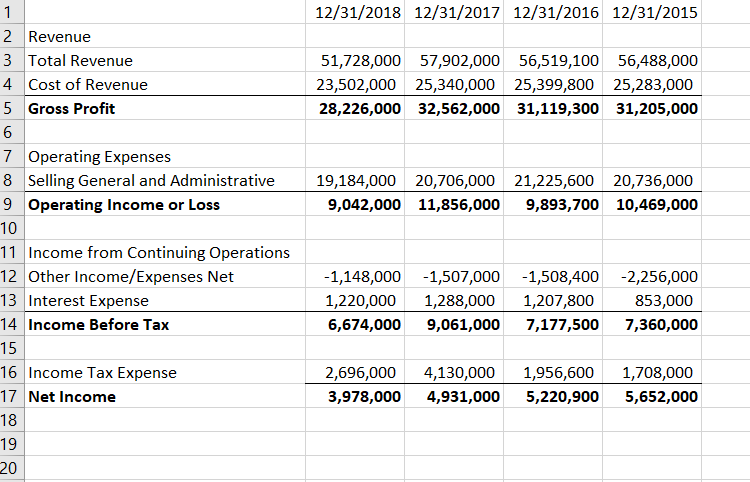
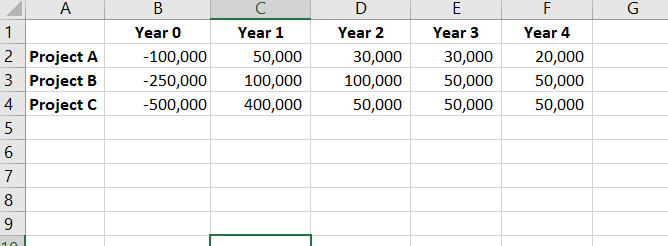 Option #1: Corporate Finance Application Part A: Ratio Analysis (Week 3 Milestone) Attached are the financial statements for Smith Company, Inc. Use the financial statements to calculate the attached ratios. Write a couple sentences interpreting the ratio. Calculate and interpret the following debt ratios: debt ratio, debt-equity ratio, and times interest earned. Calculate and interpret the following profitability ratios: operating profit margin, net profit margin, return on assets, and return on equity. Part B: Require Return for Capital Funding (Week 5 Milestone) Suppose that Smith Company is considering a new project. They are trying to determine the required rate of return for their debt and equity holders. See the information below: A 7.5% percent annual coupon bond with 20 years to maturity, selling for 104 percent of par. The bonds make semiannual payments. What is the before tax cost of debt? If the tax rate is 40%, what is the after-tax cost of debt? The firm's beta is 1.2. The risk-free rate is 4.0% and the expected market return is 9%. What is the cost of equity using CAPM? Part C: WACC and Capital Budgeting Calculate the firm's WACC (using 2018 numbers). (You will need to collect information on the long-term debt and common stock equity from the Balance Sheet. The firm has no preferred stock). Use the WACC to calculate NPV and evaluate IRR for proposed capital budgeting projects. Assume the projects are mutually exclusive and the firm has the money available to fund the project. Part D: Analysis You will must offer suggests to a senior financial manager and CFO on the proposed projects. Be sure to include a discussion of external funding and where it should come from if necessary and which project the firm should undertake. Prepare a presentation, a minimum of one slide for each part, summarizing your results. You should submit either an Excel or Word document showing your work for each part.
Step by Step Solution
There are 3 Steps involved in it
Step: 1

Get Instant Access to Expert-Tailored Solutions
See step-by-step solutions with expert insights and AI powered tools for academic success
Step: 2

Step: 3
Ace Your Homework with AI
Get the answers you need in no time with our AI-driven, step-by-step assistance
Get Started
Sustainable Finance And Banking
Authors: Marcel Jeucken
1st Edition
1853837660, 978-1853837661