

Answered step by step
Verified Expert Solution
Question
1 Approved Answer
options for drop down 1: decreased or increased options for drop down 2: $3.0, $2.0, $0.5, $2.5 The following graph shows the supply of and
 options for drop down 1: decreased or increased
options for drop down 2: $3.0, $2.0, $0.5, $2.5
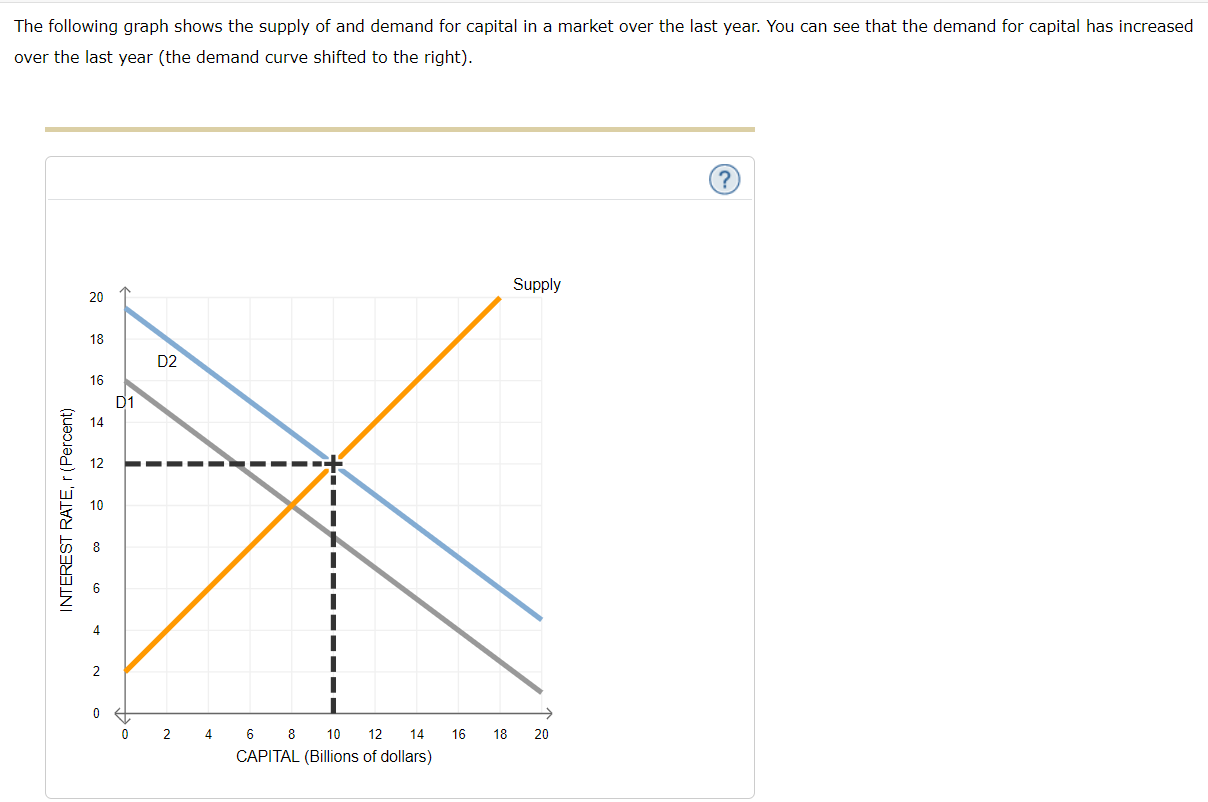
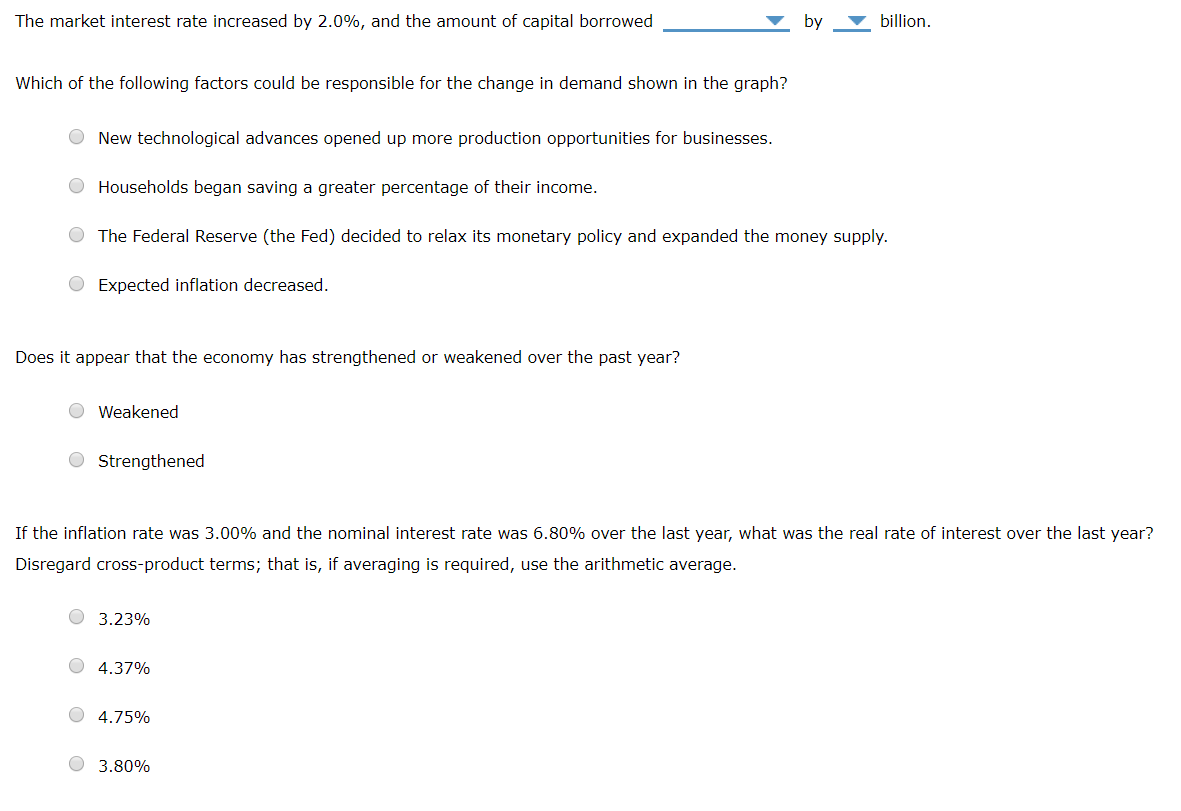
The following graph shows the supply of and demand for capital in a market over the last year. You can see that the demand for capital has increased over the last year (the demand curve shifted to the right). Supply 02 INTEREST RATE, r(Percent) 0 2 4 16 18 20 6 8 10 12 14 CAPITAL (Billions of dollars) The market interest rate increased by 2.0%, and the amount of capital borrowed by billion. Which of the following factors could be responsible for the change in demand shown in the graph? New technological advances opened up more production opportunities for businesses. Households began saving a greater percentage of their income. The Federal Reserve (the Fed) decided to relax its monetary policy and expanded the money supply. O Expected inflation decreased. Does it appear that the economy has strengthened or weakened over the past year? O Weakened Strengthened If the inflation rate was 3.00% and the nominal interest rate was 6.80% over the last year, what was the real rate of interest over the last year? Disregard cross-product terms; that is, if averaging is required, use the arithmetic average. O 3.23% 4.37% 4.75% O 3.80%Step by Step Solution
There are 3 Steps involved in it
Step: 1

Get Instant Access to Expert-Tailored Solutions
See step-by-step solutions with expert insights and AI powered tools for academic success
Step: 2

Step: 3
Ace Your Homework with AI
Get the answers you need in no time with our AI-driven, step-by-step assistance
Get Started
Adventure Capitalist The Ultimate Road Trip
Authors: Jim Rogers
1st Edition
0375509127, 978-0375509124