Answered step by step
Verified Expert Solution
Question
1 Approved Answer
Our financial projections assume that S'Naps will be in operation at the beginning of Year 1. We estimate that we will capture 1% of


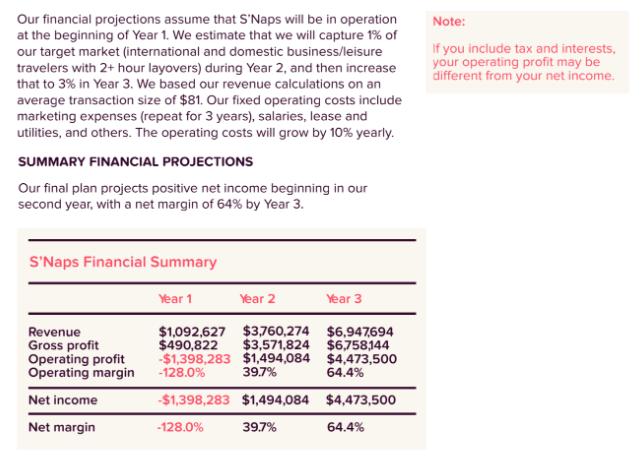
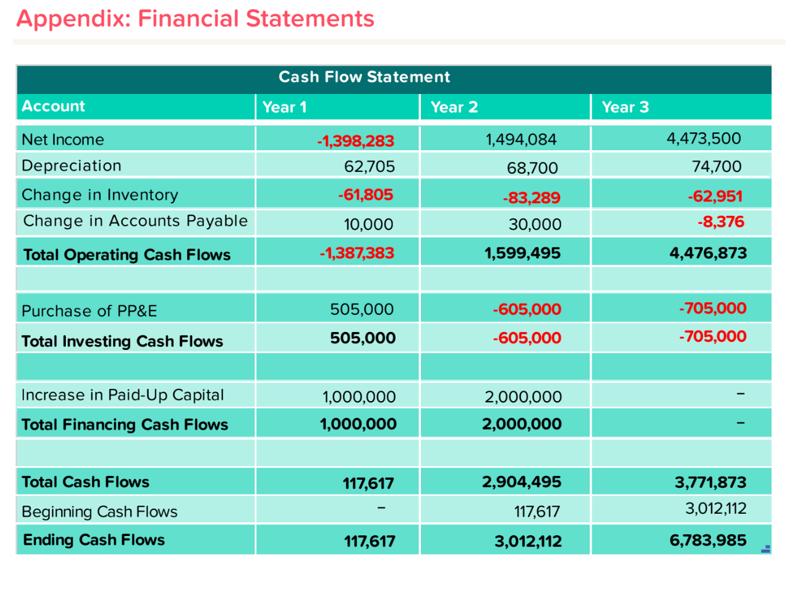
Our financial projections assume that S'Naps will be in operation at the beginning of Year 1. We estimate that we will capture 1% of our target market (international and domestic business/leisure travelers with 2+ hour layovers) during Year 2, and then increase that to 3% in Year 3. We based our revenue calculations on an average transaction size of $81. Our fixed operating costs include marketing expenses (repeat for 3 years), salaries, lease and utilities, and others. The operating costs will grow by 10% yearly. SUMMARY FINANCIAL PROJECTIONS Our final plan projects positive net income beginning in our second year, with a net margin of 64% by Year 3. S'Naps Financial Summary Revenue Gross profit Operating profit Operating margin Net income Net margin Year 2 Year 1 $1,092,627 $3,760,274 $490,822 $3,571,824 -$1,398,283 $1,494,084 -128.0% 39.7% -$1,398,283 $1,494,084 -128.0% 39.7% Year 3 $6,947,694 $6,758144 $4,473,500 64.4% $4,473,500 64.4% Note: If you include tax and interests, your operating profit may be different from your net income. Our financial projections assume that S'Naps will be in operation at the beginning of Year 1. We estimate that we will capture 1% of our target market (international and domestic business/leisure travelers with 2+ hour layovers) during Year 2, and then increase that to 3% in Year 3. We based our revenue calculations on an average transaction size of $81. Our fixed operating costs include marketing expenses (repeat for 3 years), salaries, lease and utilities, and others. The operating costs will grow by 10% yearly. SUMMARY FINANCIAL PROJECTIONS Our final plan projects positive net income beginning in our second year, with a net margin of 64% by Year 3. S'Naps Financial Summary Revenue Gross profit Operating profit Operating margin Net income Net margin Year 2 Year 1 $1,092,627 $3,760,274 $490,822 $3,571,824 -$1,398,283 $1,494,084 -128.0% 39.7% -$1,398,283 $1,494,084 -128.0% 39.7% Year 3 $6,947,694 $6,758144 $4,473,500 64.4% $4,473,500 64.4% Note: If you include tax and interests, your operating profit may be different from your net income. Appendix: Financial Statements Account Net Income Depreciation Change in Inventory Change in Accounts Payable Total Operating Cash Flows Purchase of PP&E Total Investing Cash Flows Increase in Paid-Up Capital Total Financing Cash Flows Total Cash Flows Beginning Cash Flows Ending Cash Flows Cash Flow Statement Year 1 -1,398,283 62,705 -61,805 10,000 -1,387,383 505,000 505,000 1,000,000 1,000,000 117,617 117,617 Year 2 1,494,084 68,700 -83,289 30,000 1,599,495 -605,000 -605,000 2,000,000 2,000,000 2,904,495 117,617 3,012,112 Year 3 4,473,500 74,700 -62,951 -8,376 4,476,873 -705,000 -705,000 3,771,873 3,012,112 6,783,985
Step by Step Solution
★★★★★
3.38 Rating (145 Votes )
There are 3 Steps involved in it
Step: 1
Based on the financial projections provided here is a summary of the financial information for SNaps ...
Get Instant Access to Expert-Tailored Solutions
See step-by-step solutions with expert insights and AI powered tools for academic success
Step: 2

Step: 3

Ace Your Homework with AI
Get the answers you need in no time with our AI-driven, step-by-step assistance
Get Started


