Question
Outline Simpson Alternative Investments (SAI) is a boutique fund manager that invests in environmentally- friendly/green projects. Based in Brisbane with approximately $1.2 billion of managed

 Outline
Simpson Alternative Investments (SAI) is a boutique fund manager that invests in environmentally- friendly/green projects. Based in Brisbane with approximately $1.2 billion of managed investments, its main clientele are other fund managers seeking exposure to green investments as either an investment strategy or to meet the green investment mandates of their investors.
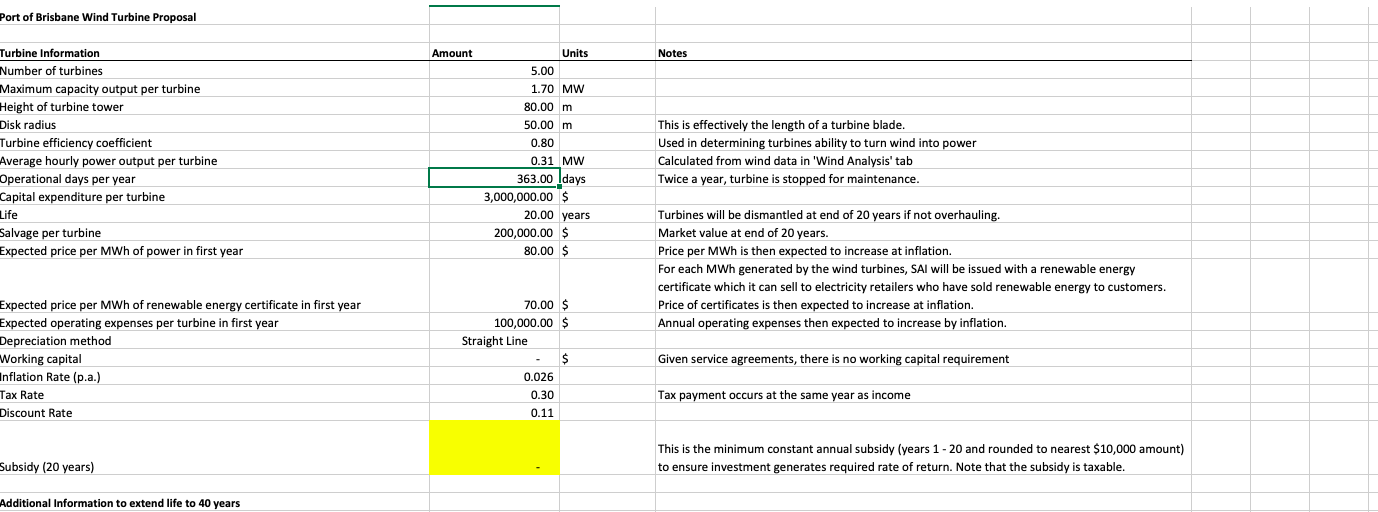
Recently, the investment team, under the leadership of Dr Stilton, has been considering a new wind turbine project to be owned and operated by HAI. The project consists of five 1.7 megawatt (MW), 130 metre (m) high wind turbines to be installed around the Port of Brisbane. The impact of the turbines should be minimal given the selected location, the fact that no neighbouring allotments are within 1,500m of the proposed turbines and there are no nearby radio and television broadcasting antennae. However, approval will be required from Civil Aviation Safety Authority (CASA) due to its proximity to the Brisbane airport (height of turbines and possible radar disturbance).
The project is unlikely to be economically viable given the current market price of electricity and the fact that Brisbane is not one of the windiest areas in Australia. In light of this, the investment team will propose to the local government that they subsidy the project given its environmental benefits. Given that Brisbane is the host city of Olympic Games 2032 and the local government wants to build up the Green image, they are keen to support Green projects. The proposal will contain a variety of sections, including an environment assessment and analysis of required regulatory approvals, but your task is to complete the financial feasibility analysis and associated report. The PoB Wind Turbine Proposal file provides project details and your task is outlined below.
Task
Provide a detailed financial analysis of the wind turbines and an accompanying report that explains and justifies methodology, summarises findings and recommends an appropriate subsidy for local government to contribute, and highlights limitations with the analysis and recommendations. To complete this task, your manager has requested the following:
-
- The financial analysis is to be completed in Excel. The file is to be easily adjustable for different scenarios and all inputs must be in the one sheet called Assumptions.
Port of Brisbane Wind Turbine Proposal Amount Notes Turbine Information Number of turbines Maximum capacity output per turbine Height of turbine tower Disk radius Turbine efficiency coefficient Average hourly power output per turbine Operational days per year Capital expenditure per turbine Life Salvage per turbine Expected price per MWh of power in first year Units 5.00 1.70 MW 80.00 m 50.00 m 0.80 0.31 MW 363.00 ldays 3,000,000.00 $ 20.00 years 200,000.00 $ 80.00 $ This is effectively the length of a turbine blade. Used in determining turbines ability to turn wind into power Calculated from wind data in 'Wind Analysis' tab Twice a year, turbine is stopped for maintenance. Turbines will be dismantled at end of 20 years if not overhauling. Market value at end of 20 years. Price per MWh is then expected to increase at inflation. For each MWh generated by the wind turbines, SAI will be issued with a renewable energy certificate which it can sell to electricity retailers who have sold renewable energy to customers. Price of certificates is then expected to increase at inflation. Annual operating expenses then expected to increase by inflation. Expected price per MWh of renewable energy certificate in first year Expected operating expenses per turbine in first year Depreciation method Working capital Inflation Rate (p.a.) Tax Rate Discount Rate 70.00 $ 100,000.00 $ Straight Line $ Given service agreements, there is no working capital requirement 0.026 Tax payment occurs at the same year as income 0.30 0.11 This is the minimum constant annual subsidy (years 1 - 20 and rounded to nearest $10,000 amount) to ensure investment generates required rate of return. Note that the subsidy is taxable. Subsidy (20 years) Additional Information to extend life to 40 years Brisbane Airport Wind Data, Speed and Direction Probabilities Source: Australian Bureau of Meteorology Turbine Information Disk Area (A) 7853.98 Efficiency (C) 0.80 Ave. Air Density (p) 1.18 Direction S 9am Data N E SE w NW Wind Speed Km/h > and 10 and 20 and 30 and 40 Column Totals 3.4 3.0 0.7 0.0 0.0 7.2 NE 1.7 1.8 0.3 0.0 0.0 3.9 1.8 3.2 1.3 0.2 0.0 6.5 3.0 4.6 2.4 0.3 0.0 10. 8.8 12.0 2.3 0.1 0.0 23.3 SW 10.7 11.9 2.4 0.2 0.0 25.3 2.7 2.4 1.7 0.5 0.1 7.4 3.0 1.3 0.2 0.0 0.0 4.5 Calm 11.7 0.0 0.0 0.0 0.0 11.7 Row Totals 46.9 40.3 11.4 1.3 0.2 100.0 Conversion wind speed to metres per second (m/s) Low km/h High Km/h Low m/s High m/s Ave. m/s V) 0.0 10.0 0.0 2.8 1.4 10.0 20.0 2.8 5.6 4.2 20.0 30.0 5.6 8.3 6.9 30.0 40.0 8.3 11.1 9.7 40.0 50.0 11.1 13.9 12.5 Power Output Watts (w) - Betz's Formula, P = 16/27 x 0.5 xPxAx3 x 0 0 159,315 737,570 1,700,000 1,700,000 Prob. Weighted Output 0 64,204 84,083 22,100 3,400 173,787 N 3pm Data > and 10 and = 20 and = 30 and 40 Column Totals Wind Speed Km/h NE 3.5 13.1 6.9 0.8 0.1 24.3 SE 1.2 4.9 7.0 1.4 3.8 4.6 1.4 0.3 11.6 E 2.5 11.8 10.6 0.9 0.0 25.9 Direction s 1.7 2.4 1.3 0.3 0.0 5.7 SW 1.6 1.8 1.4 0.4 0.1 5.4 W 1.2 3.1 3.4 1.2 0.3 9.2 NW 0.5 0.5 0.2 0.0 0.0 1.3 Calm 1.9 0.0 0.0 0.0 0.0 1.9 Row Totals 15.7 41.5 35.4 6.4 1.0 100.0 Conversion wind speed to metres per second (m/s) Low Km/h High Km/h Low m/s High m/s Ave. m/s 0.0 10.0 0.0 2.8 1.4 10.0 20.0 2.8 5.6 4.2 20.0 30.0 5.6 8.3 6.9 30.0 40.0 8.3 11.1 9.7 40.0 50.0 11.1 13.9 12.5 Power Output Watts (w) - Betz's Formula, P = 16/27 x 0.5 x P x A x 13 xC 0 159,315 737,570 1,700,000 1,700,000 Prob. Weighted Output 0 66,116 261,100 108,800 17,000 453,016 1.4 0.1 14.6 Ave. Output per hour per day (w) 313,401 Port of Brisbane Wind Turbine Proposal Amount Notes Turbine Information Number of turbines Maximum capacity output per turbine Height of turbine tower Disk radius Turbine efficiency coefficient Average hourly power output per turbine Operational days per year Capital expenditure per turbine Life Salvage per turbine Expected price per MWh of power in first year Units 5.00 1.70 MW 80.00 m 50.00 m 0.80 0.31 MW 363.00 ldays 3,000,000.00 $ 20.00 years 200,000.00 $ 80.00 $ This is effectively the length of a turbine blade. Used in determining turbines ability to turn wind into power Calculated from wind data in 'Wind Analysis' tab Twice a year, turbine is stopped for maintenance. Turbines will be dismantled at end of 20 years if not overhauling. Market value at end of 20 years. Price per MWh is then expected to increase at inflation. For each MWh generated by the wind turbines, SAI will be issued with a renewable energy certificate which it can sell to electricity retailers who have sold renewable energy to customers. Price of certificates is then expected to increase at inflation. Annual operating expenses then expected to increase by inflation. Expected price per MWh of renewable energy certificate in first year Expected operating expenses per turbine in first year Depreciation method Working capital Inflation Rate (p.a.) Tax Rate Discount Rate 70.00 $ 100,000.00 $ Straight Line $ Given service agreements, there is no working capital requirement 0.026 Tax payment occurs at the same year as income 0.30 0.11 This is the minimum constant annual subsidy (years 1 - 20 and rounded to nearest $10,000 amount) to ensure investment generates required rate of return. Note that the subsidy is taxable. Subsidy (20 years) Additional Information to extend life to 40 years Brisbane Airport Wind Data, Speed and Direction Probabilities Source: Australian Bureau of Meteorology Turbine Information Disk Area (A) 7853.98 Efficiency (C) 0.80 Ave. Air Density (p) 1.18 Direction S 9am Data N E SE w NW Wind Speed Km/h > and 10 and 20 and 30 and 40 Column Totals 3.4 3.0 0.7 0.0 0.0 7.2 NE 1.7 1.8 0.3 0.0 0.0 3.9 1.8 3.2 1.3 0.2 0.0 6.5 3.0 4.6 2.4 0.3 0.0 10. 8.8 12.0 2.3 0.1 0.0 23.3 SW 10.7 11.9 2.4 0.2 0.0 25.3 2.7 2.4 1.7 0.5 0.1 7.4 3.0 1.3 0.2 0.0 0.0 4.5 Calm 11.7 0.0 0.0 0.0 0.0 11.7 Row Totals 46.9 40.3 11.4 1.3 0.2 100.0 Conversion wind speed to metres per second (m/s) Low km/h High Km/h Low m/s High m/s Ave. m/s V) 0.0 10.0 0.0 2.8 1.4 10.0 20.0 2.8 5.6 4.2 20.0 30.0 5.6 8.3 6.9 30.0 40.0 8.3 11.1 9.7 40.0 50.0 11.1 13.9 12.5 Power Output Watts (w) - Betz's Formula, P = 16/27 x 0.5 xPxAx3 x 0 0 159,315 737,570 1,700,000 1,700,000 Prob. Weighted Output 0 64,204 84,083 22,100 3,400 173,787 N 3pm Data > and 10 and = 20 and = 30 and 40 Column Totals Wind Speed Km/h NE 3.5 13.1 6.9 0.8 0.1 24.3 SE 1.2 4.9 7.0 1.4 3.8 4.6 1.4 0.3 11.6 E 2.5 11.8 10.6 0.9 0.0 25.9 Direction s 1.7 2.4 1.3 0.3 0.0 5.7 SW 1.6 1.8 1.4 0.4 0.1 5.4 W 1.2 3.1 3.4 1.2 0.3 9.2 NW 0.5 0.5 0.2 0.0 0.0 1.3 Calm 1.9 0.0 0.0 0.0 0.0 1.9 Row Totals 15.7 41.5 35.4 6.4 1.0 100.0 Conversion wind speed to metres per second (m/s) Low Km/h High Km/h Low m/s High m/s Ave. m/s 0.0 10.0 0.0 2.8 1.4 10.0 20.0 2.8 5.6 4.2 20.0 30.0 5.6 8.3 6.9 30.0 40.0 8.3 11.1 9.7 40.0 50.0 11.1 13.9 12.5 Power Output Watts (w) - Betz's Formula, P = 16/27 x 0.5 x P x A x 13 xC 0 159,315 737,570 1,700,000 1,700,000 Prob. Weighted Output 0 66,116 261,100 108,800 17,000 453,016 1.4 0.1 14.6 Ave. Output per hour per day (w) 313,401
Step by Step Solution
There are 3 Steps involved in it
Step: 1

Get Instant Access to Expert-Tailored Solutions
See step-by-step solutions with expert insights and AI powered tools for academic success
Step: 2

Step: 3

Ace Your Homework with AI
Get the answers you need in no time with our AI-driven, step-by-step assistance
Get Started


