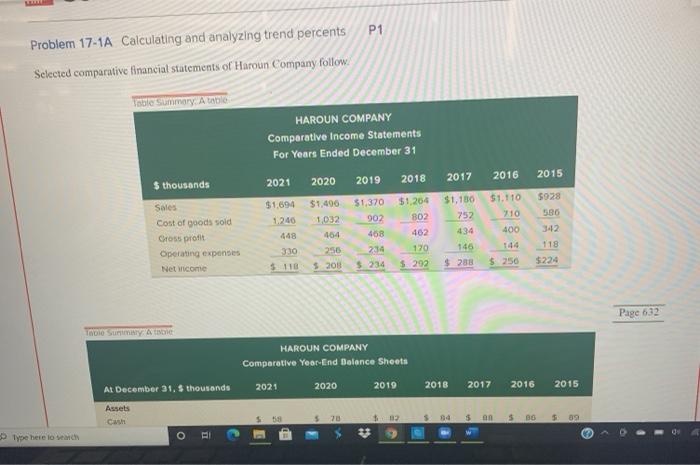
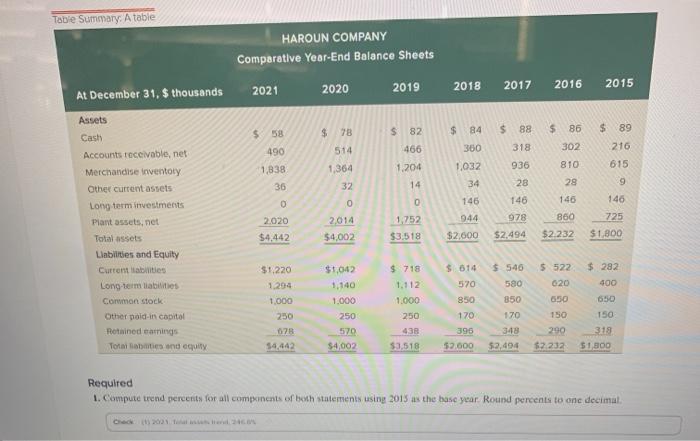
P1 Problem 17-1A Calculating and analyzing trend percents Selected comparative financial statements of Haroun Company follow. Table Summary: Art HAROUN COMPANY Comparative Income Statements For Years Ended December 31 2019 2018 2017 2016 2021 2020 2015 S thousands Sales Cost of goods sold Cross profit Operating expenses Netcome $1.110 210 $1,094 1.240 448 339 $1,490 1,032 464 256 $ 200 $1,370 902 468 234 $ 234 $1.264 802 402 170 5. 292 $1,180 752 434 400 $928 580 342 118 $224 $ 238 $250 Page 632 HAROUN COMPANY Comparative Year-End Balance Sheets 2021 2020 2019 Al December 31. S thousands 2018 2017 2016 2015 Assets $ 18 5 70 32 $94 $an $ 36 509 Type here lover Table Summary: A table HAROUN COMPANY Comparative Year-End Balance Sheets 2020 2019 2021 2018 2017 2016 2015 At December 31, $ thousands $ $ 82 88 $ 86 $ $ 78 514 $ 89 216 490 $ 84 350 1,032 466 318 302 810 1,204 936 615 1,364 32 1,838 36 0 14 34 28 9 28 146 0 0 146 146 044 978 860 Assets Cash Accounts receivable, net Merchandise inventory Other current assets Long term investments Plant assets.net Total assets Liabilities and Equity Current liabilities Long-term diabilities Common stock Other paid in capital Retained earnings Total dates and equity 2020 $4,442 2014 $4,002 1.752 $3.518 146 725 $1,800 $2,600 $2,494 $2.232 $1,042 $.614 $1,220 1.294 1,000 250 $ 282 400 $ 718 1.112 1.000 250 438 $ 522 020 650 570 850 1.000 250 $ 540 580 850 170 348 $2,494 078 $4,442 570 $4,002 170 395 $2.000 150 290 $2.232 150 319 $1,800 $3.518 Required 1. Compute trend percents for all components of both statements using 2015 as the base year Round percents to onc decimal Required 1. Compute trend percents for all components of both statements using 2015 as the base year. Round percents to one decimal Check (112021. Totalt trend, 246.8% Analysis Component 2. Refer to the results from part 1. (a) Did sales grow steadily over this period? (b) Did net income as a percent of sales grow over the past four years! (c) Did inventory increase over this period