Answered step by step
Verified Expert Solution
Question
1 Approved Answer
P12-4 (similar to) table. Initial investment (CF) Outcome Pessimistic Most likely Optimistic Project A Project B $12,400 $12.400 Annual cash inflows (CF) $900 $1,520 1,600
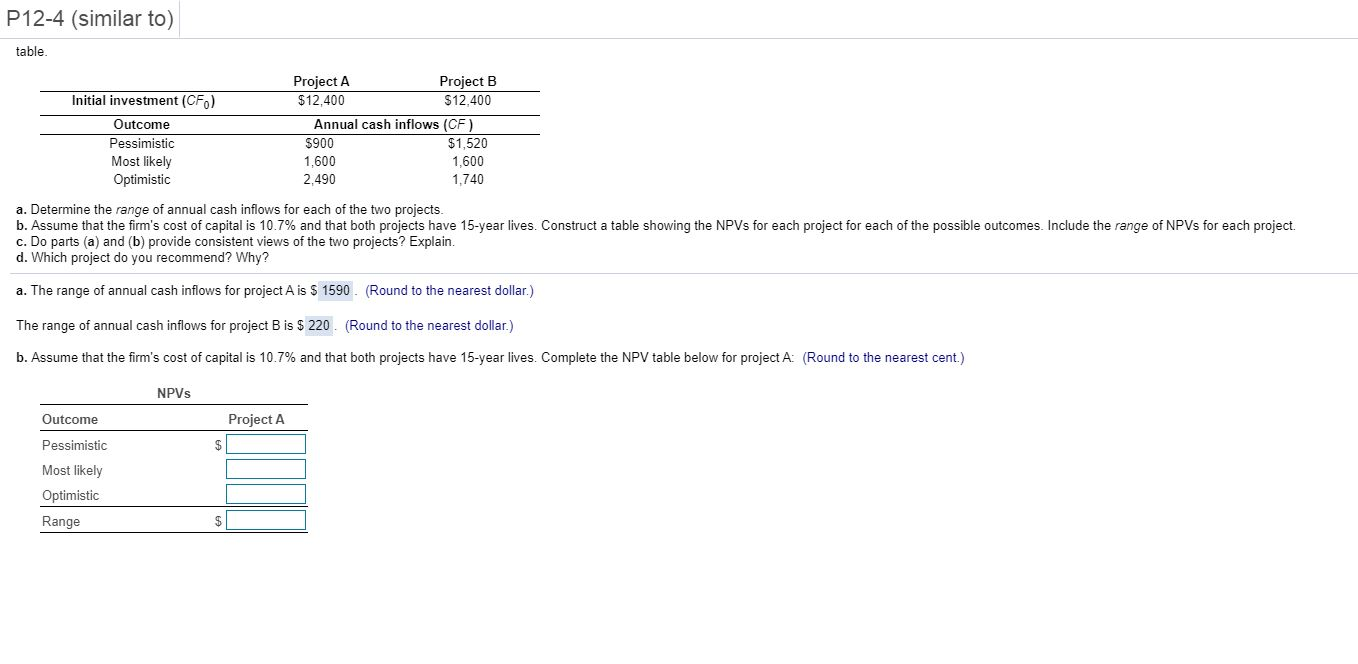
P12-4 (similar to) table. Initial investment (CF) Outcome Pessimistic Most likely Optimistic Project A Project B $12,400 $12.400 Annual cash inflows (CF) $900 $1,520 1,600 1,600 2.490 1,740 a. Determine the range of annual cash inflows for each of the two projects. b. Assume that the firm's cost of capital is 10.7% and that both projects have 15-year lives. Construct a table showing the NPVs for each project for each of the possible outcomes. Include the range of NPVs for each project. c. Do parts (a) and (b) provide consistent views of the two projects? Explain. d. Which project do you recommend? Why? a. The range of annual cash inflows for project A is $ 1590. (Round to the nearest dollar.) The range of annual cash inflows for project B is $ 220. (Round to the nearest dollar.) b. Assume that the firm's cost of capital is 10.7% and that both projects have 15-year lives. Complete the NPV table below for project A: (Round to the nearest cent.) NPVs Project A Outcome Pessimistic Most likely Optimistic Range $
Step by Step Solution
There are 3 Steps involved in it
Step: 1
Get Instant Access to Expert-Tailored Solutions
See step-by-step solutions with expert insights and AI powered tools for academic success
Step: 2
Step: 3
Ace Your Homework with AI
Get the answers you need in no time with our AI-driven, step-by-step assistance
Get Started