

Question
P2-41. Comparing Operating Characteristics across Industries (LO1) Following are selected income statement and balance sheet data for companies in different industries. Required a. Compute the
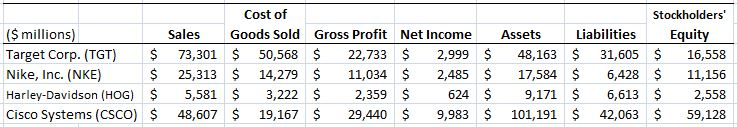
P2-41. Comparing Operating Characteristics across Industries (LO1)
Following are selected income statement and balance sheet data for companies in different industries.
Required
a. Compute the following rations for each company.
-Gross profit/Sales
-Net income/Sales
-Net income/Stockholders' equity
-Liabilities/Stockholders' equity
b. Comment on any differences among the companies' gross profit to sales ratios and net income as a percentage of sales. Do differences in the companies' business models explain the differences observed?
c. Which company reports the highest ratio of net income to equity? Suggest one or more reasons for this result.
d. Which company has financed itself with the highest percentage of liabilities to equity? Suggest one or more reasons why this company can take on such debt levels.
Please answer all parts of the question
Cost of Stockholders' (S millions) Sales Goods Sold Gross Profit Net IncomeAssets $millions) Target Corp. (TGT) 73,301 50,568 22,733 2,999 48,163 31,605 16,558 Nike, Inc. (NKE) 25,313$ 14,279 11,034 2,485 17,5846,42811,156 Harley-Davidson (HOG) $ 5,581 $ 3,2222,359 6249,171 $ 6,613 $ 2,558 Cisco Systems (CSCO)$ 48,607 19,167 29,4409,983 101,191 42,063 59,128 Sales Goods Sold Gross Profit Net Income Assets abilities Equity $ 25,313 $ 14,279 $ 11,034$ 2,485 $17,584 $ 6,428 $11,156Step by Step Solution
There are 3 Steps involved in it
Step: 1

Get Instant Access to Expert-Tailored Solutions
See step-by-step solutions with expert insights and AI powered tools for academic success
Step: 2

Step: 3
Ace Your Homework with AI
Get the answers you need in no time with our AI-driven, step-by-step assistance
Get Started
Sustainable Finance And Banking
Authors: Marcel Jeucken
1st Edition
1853837660, 978-1853837661