

Question
P2-42. Comparing Cash Flows across Retailers (LO1) Following are selected accounts from the income statement and the statement of cash flows for several retailers, for
P2-42. Comparing Cash Flows across Retailers (LO1)
Following are selected accounts from the income statement and the statement of cash flows for several retailers, for their fiscal years ended in 2013.
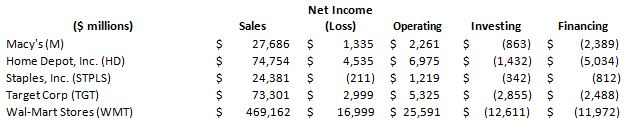
Required a. Compute the ratio of net income to sales for each company. Rank the companies on the basis of this ratio. Do their respective business models give insight into these differences?
b. Compute net cash flows from operating activities as a percentage of sales. Rank the companies on the basis of this ratio. Does this ranking coincide with the ration rankings from part a? Suggest one or more reasons for any differences you observe.
d. All of these companies report negative cash flows from financing actives. What does it mean for a company to have net cash outflow from financing?
Net Income $ millions) Sales (Loss) Operating Investing Financing Macy's (M) Home Depot, Inc. (HD) Staples, Inc. (STPLS) Target Corp (TGT) Wal-Mart Stores (WMT) $ 27,686 1,335 2,261 $(863) $ (2,389) $ 74,754 $ 4,535 6,975 (1,432) $5,034) $ 24,381 211 1,219 $(342) $ (812) $ 73,301 $,999 5,325 $ (2,855) $ (2,488) S 469,162 $16,999 25,591 12,611) (11,972)Step by Step Solution
There are 3 Steps involved in it
Step: 1

Get Instant Access to Expert-Tailored Solutions
See step-by-step solutions with expert insights and AI powered tools for academic success
Step: 2

Step: 3
Ace Your Homework with AI
Get the answers you need in no time with our AI-driven, step-by-step assistance
Get Started
The Handbook Of Financial Communication And Investor Relations
Authors: Alexander V. Laskin
1st Edition
1119240786, 978-1119240785