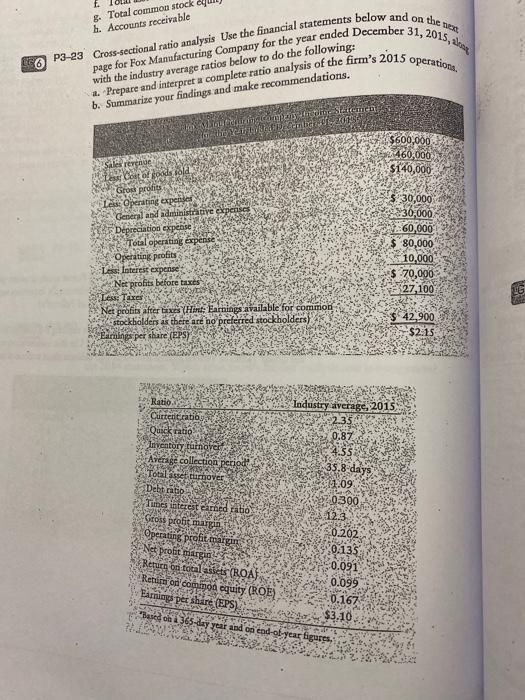
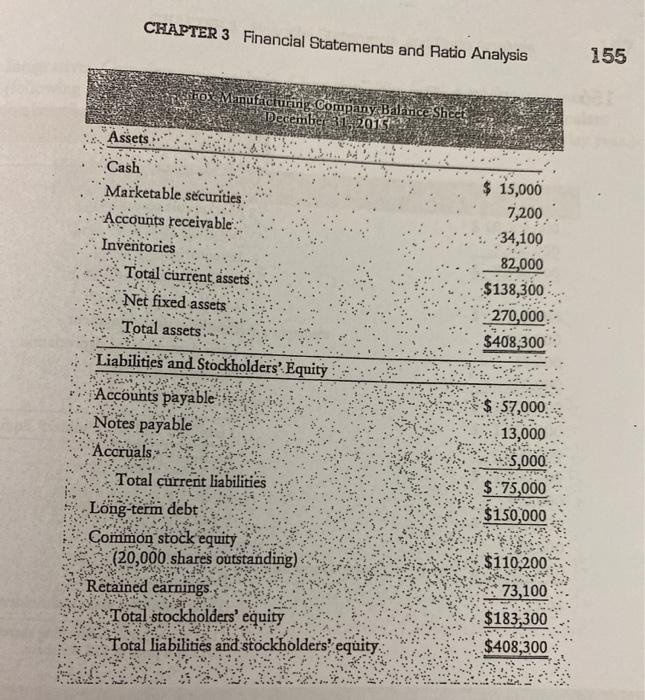
P3 23 Cross-sectional ratio analysis Use the financial statements below and on the tu page for Fox Manufacturing Company for the year ended December 31, 2015, 2. Prepare and interpreta complete ratio analysis of the firm's 2015 operations, g. Total common stock h. Accounts receivable 6 with the industry average ratios below to do the following: b. your make recommendations. SH $600,000 460,000 $140,000 Srecno Les Cort of gods old Gros profits Les Operating experies General and administrative expens Depreciation expense Total operating expense Operating profits Less: Interest expense Net profits before taxes Less: Taxes Net profits after taxes (Hint: Eamings available for common stockholders as there are no preferred stockholders) Earnings per share (EPS) 5. 30,000 $30,000 60,000 $ 80,000 10,000 $ 70,000 27,100 $ 42,900. $2.15 Ratio Current ratio Quick ratio Inventory turnover Average collection periode Total asset turnover Debratio Tienesteret erond ratio Gloss profit margin Operating profit margin Net profit margin Return on total asies (ROA Return on commoa equity (ROE) Famimps per share (FPS) Based on a 365-day year and on end-of-year figures Industry average, 2015 2.35 0.87 4.55 35.8 days 1.09 0300 12.3 0.202 0.135 0.091 0.099 0.167 $3.10 CHAPTER 3 Financial Statements and Ratio Analysis 155 SIFO Manufacturing Company Balance Sheet December 31, 2015 Assets $ 15,000 7,200 34,100 82,000 $138,300 270,000 $408,300 Cash Marketable securities Accounts receivable. Inventories Total current assets Net fixed assets Total assets Liabilities and Stockholders' Equity Accounts payable Notes payable Accruals Total current liabilities Long-term debt Common stock equity (20,000 shares outstanding) Retained earnings Total stockholders' equity Total liabilities and stockholders equity. 57,000 13,000 $5,000 $ 75,000 $150,000 $110,200 73,100 $183,300 $408,300