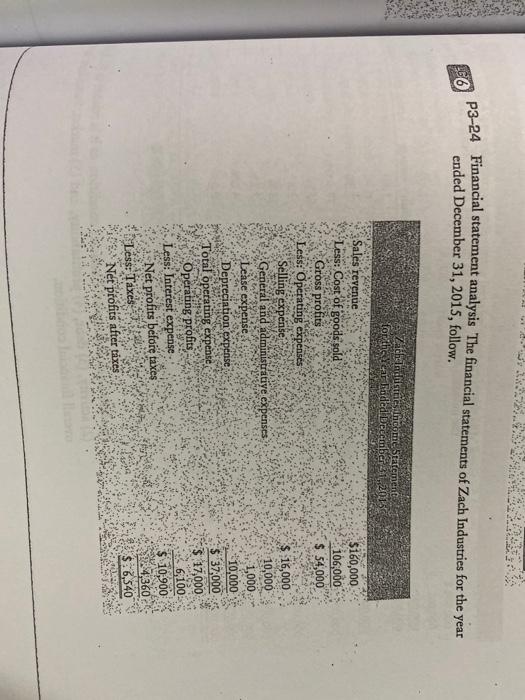
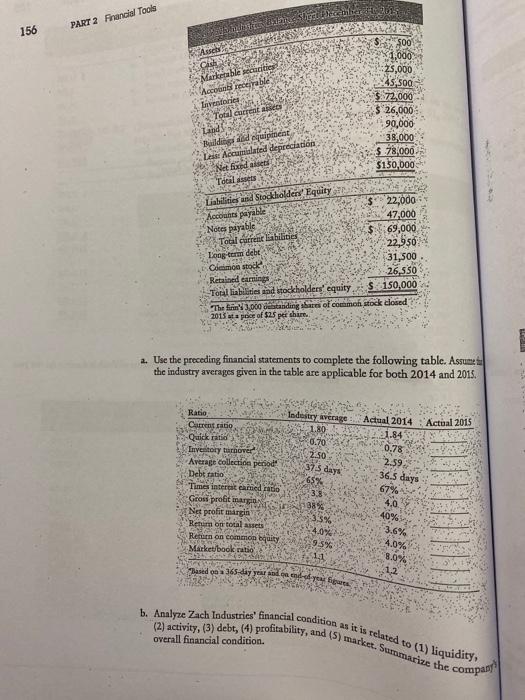
P3-24 Financial statement analysis. The financial statements of Zach Industries for the year ended December 31, 2015, follow. 266 Achleistas income Setement for the Year Faded December 21.2015 $160,000 106,000 $ 54,000 Sales revenue Less: Cost of goods sold Gross profits Less: Operating expenses Selling expense General and administrative expenses Lease expense Depreciation expense Total operating expense Operating profits Less: Interest expense Net profits before taxes Less: Taxes 16,000 10,000 1,000 10,000 37,000 $ 17,000 6,100 $ 10,900 4,360 $6,540 Net profits after taxes 11 Based 36 do FC b. Analyze Zach Industries' financial condition as it is related to (1) liquidity, (2) activity, (3) debt, (4) profitability, and (5) market. Summarize the compani 156 PART 2 Financial Tools SA ch Market ble securities con mirable Inventoria Total correst stos Tand Budd id quipient Les Accumulated depreciation Netfand siset SOO 1,000 28.000 45,500 $ 72.000 $ 26,000 90,000 38,000 $ 78,000 $150,000 Toalets Laki Stoddholders' Equity 22,000 Accounts payable 47,000 Notes payable 69,000 Toal current abilities 22,950 Tag te debt 31,500 Clicca stock 26,550 Retained earnings Total liabilities and stockholders' equity $ 150,000 The 3.000 detstanding are of common stock closed 2013 pode of $25 pet shirt. 2. Use the preceding financial statements to complete the following table. Assume the industry averages given in the table are applicable for both 2014 and 2015. Actual 2014 Actual 2015 91.84 $75 days Ratio IndiaVERSE Current to .80 tikrat 0.70 Inventory turnover 2.50 Average collection period Debt tatie 65% "Times interat med ratio 338 Gross profit margin 138% Net profit margin 3.5% Return on total assets Renn an common quity Marketbook ratio 0.78 2:59 36.5 days 67% 4.0 4.0% 9.5% 11 40% 3.6% 4.0% 8.0% 1.2 overall financial condition