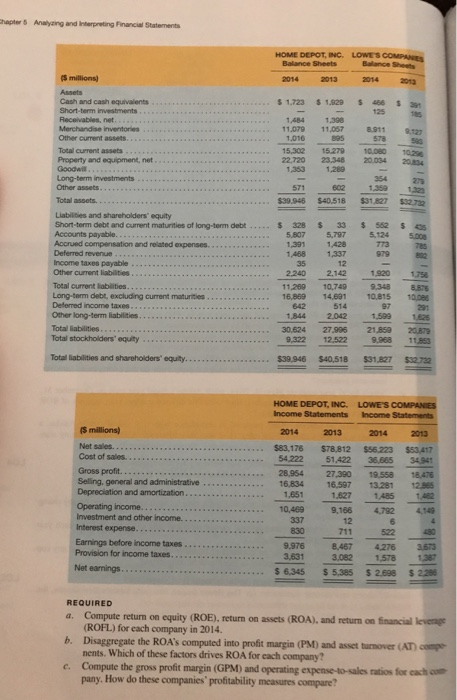
P5-38. Analysis and Interpretation of Return on Investment for Competitors Balance sheets and income statements for The Home Depot, Inc., and Lowe's Companies, Inc., follow. Refer to these financial statements to answer the requirements. LO2, 3 The Home Depot, Inc. NYSE - HD Lowe's Companies, Inc. NYSE: LOW Chapter 5 Analyzing and interpreting Financial Statements HOME DEPOT, INCLOWES COMPANIES Balance Sheets 2014 2013 2014 $ 1.723 $ 1.829 $ 456 125 2.127 1,484 11.079 1,016 15.302 22,720 1,353 1,390 11.057 895 15.270 23,348 1,280 8.911 578 10.080 20,034 571 $39.946 602 $40.518 $31.827 S millions Assets Cash and cash equivalents Short-term investments Receivables.net Merchandise inventories Other current assets Total current assets Property and equipment, net Goodall. Long-term investments Other assets Total assets. Liabilities and shareholders' equity Short-term debt and current maturities of long-term debt Accounts payable Accrued compensation and related expenses. Deferred revenue Income taxes payable Other current liabilities Total current liabilities.. Long-term debt, excluding current maturities Deferred income taxes Other long-term liabilities. Total liabilities. Total stockholders' equity $ 33 5,797 $ 552 5.124 773 979 $s 5.500 $ 328 5.807 1,391 1.468 35 2.240 11.200 16.869 1.920 1,337 12 2,142 10,749 14.691 514 2,042 27.990 12.522 10.815 97 1,599 21,850 10.09 291 1.625 1.844 30.624 9,322 11 Total liabilities and shareholders' equity. $39.946 $40,518 $31.827 HOME DEPOT, INC. LOWE'S COMPANIES Income Statements Income Statements 2013 2014 2013 553 417 18.470 Is millions) Net sales. Cost of sales Gross profit. Selling, general and administrative Depreciation and amortization Operating income. Investment and other income. Interest expense.. Earnings before income taxes Provision for income taxes. Net earnings. 2014 $83,176 54.222 28,954 16,834 1.651 10,469 337 830 9.976 3.631 $ 6,345 $78,812 51.422 27,390 16,597 1.627 9.166 12 711 8.467 3,082 5,385 $56.223 36,665 19,558 13.281 1.485 4,792 6 522 4276 1.578 $ 2.698 1382 $ 2280 REQUIRED Compute return on equity (ROE). return on assets (ROA), and return on financial leverage (ROFL.) for each company in 2014. b. Disaggregate the ROA's computed into profit margin (PM) and asset turnover (AT) compe nents. Which of these factors drives ROA for each company? c. Compute the gross profit margin (GPM) and operating expense-to-sales ratios for each.com pany. How do these companies' profitability measures compare? 261 Chapter 5 Analyzing and Interpreting Financial Statements d. Compute the accounts receivable purnover (ART), inventory turnover (INVT), and property, plant, and equipment turnover (PPET) for each company. How do these companies" turnover Compare and evaluate these competitors' performance in 2014. measures compare


