Question
Padma needs a new truck to help her expand Padma's Plumbing Palace. Business has been booming and Padma would like to accelerate her tax deductions
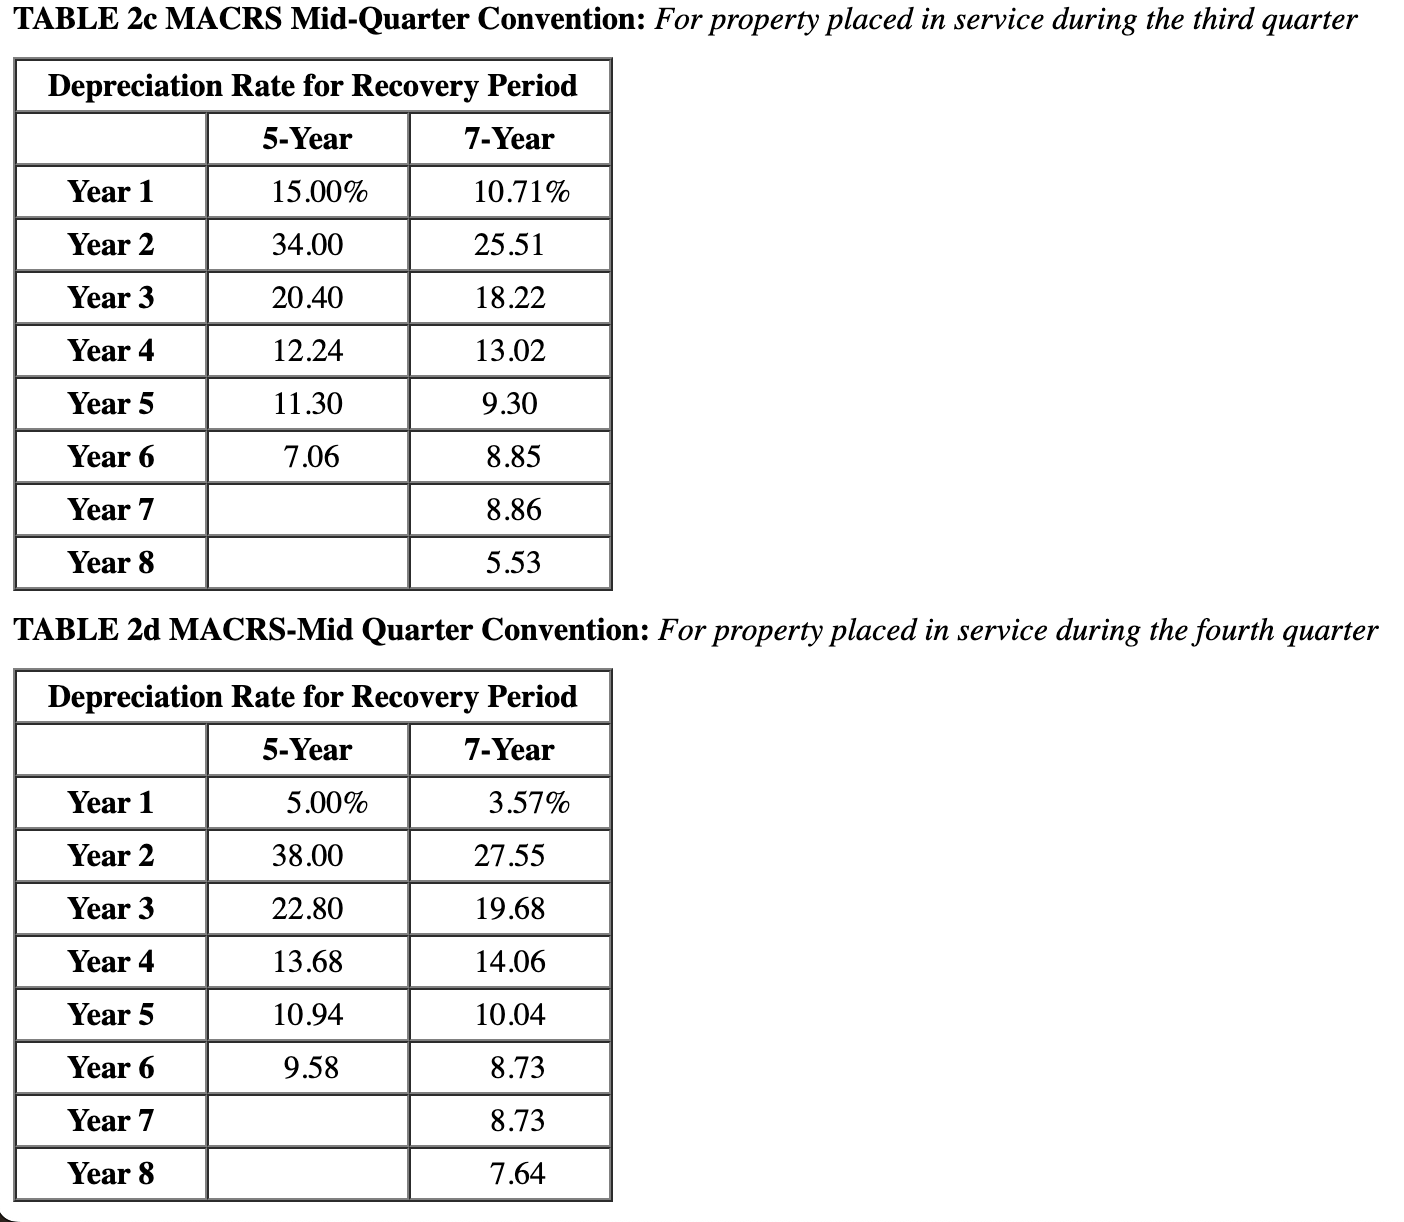
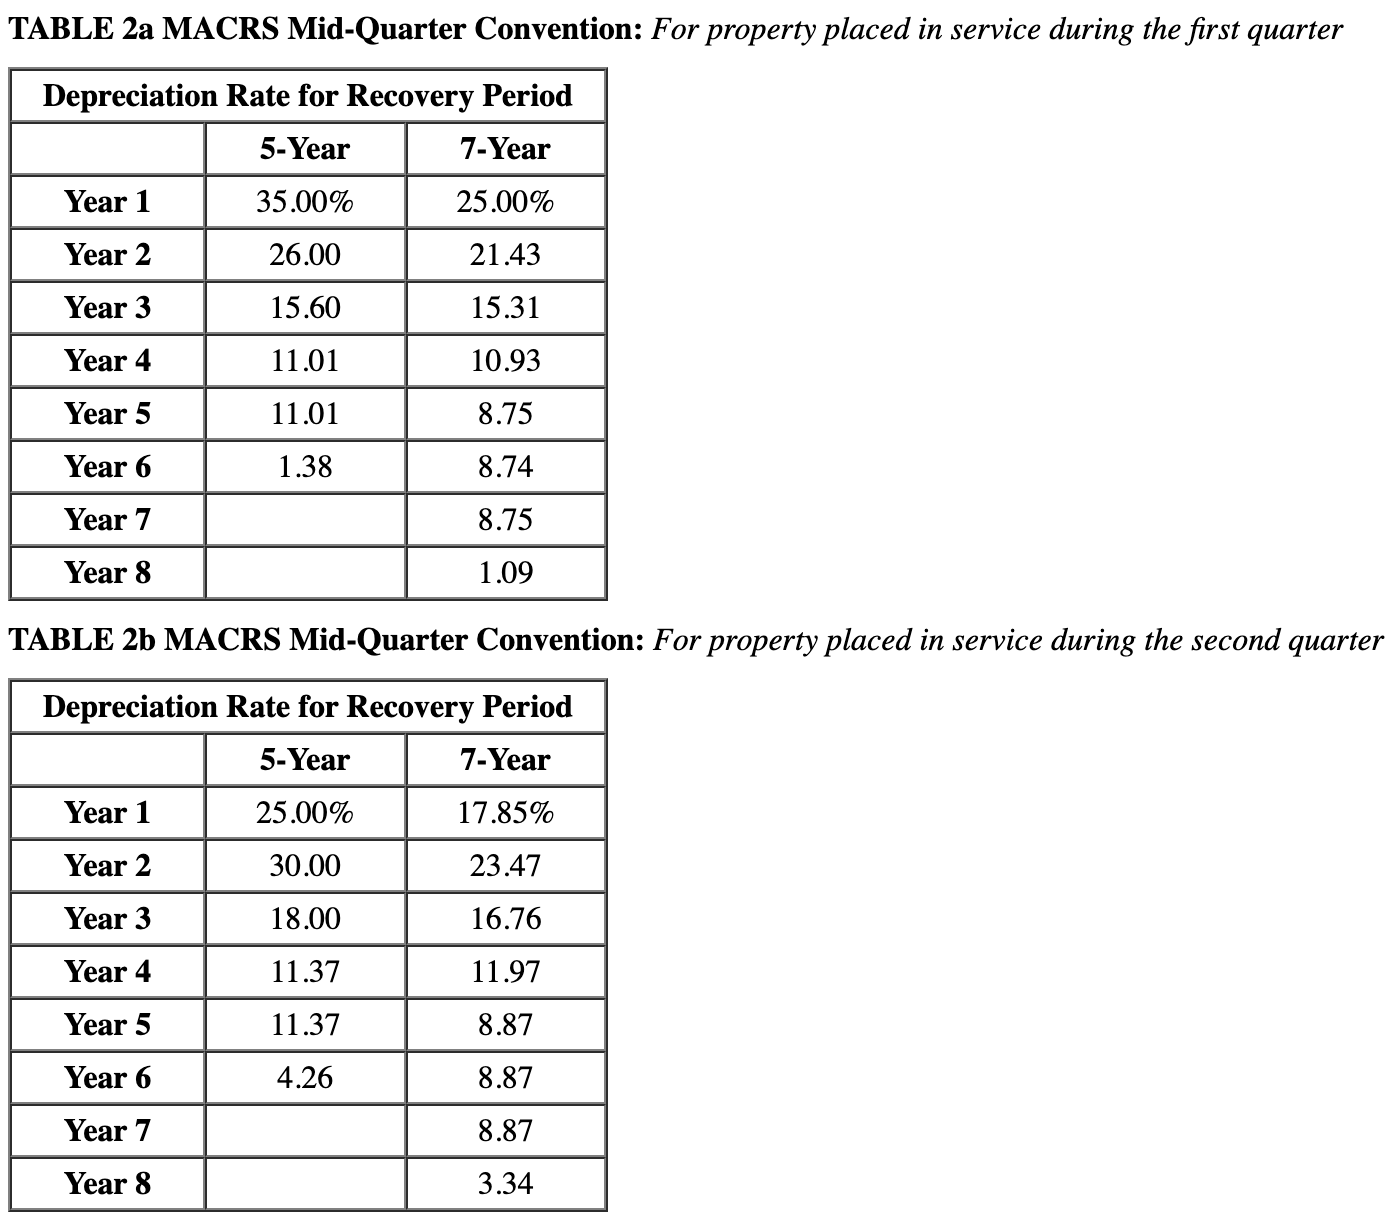
Padma needs a new truck to help her expand Padma's Plumbing Palace. Business has been booming and Padma would like to accelerate her tax deductions as much as possible (ignore 179 expense and bonus depreciation for this problem). On April 1, Padma purchased a new delivery van for $26,360.
Option 1: It is now September 26 and Padma, already in need of another vehicle, has found a deal on buying a truck for $22,960 (all fees included). The dealer tells her if she doesn't buy the truck, it will be gone tomorrow.
Option 2: There is an auction scheduled for October 5 where Padma believes she can get a similar truck for $22,300, but there is also a $660 auction fee. Padma makes no other asset acquisitions during the year.
a. Which option allows Padma to generate more depreciation deductions this year (the vehicles are not considered to be luxury autos)?
b. Assume the original facts, except that the delivery van was placed in service one day earlier on March 31 rather than April 1. Which option generates more depreciation deduction?
Table 1 MACRS Half-Year Convention
| Depreciation Rate for Recovery Period | ||||||
|---|---|---|---|---|---|---|
| 3-Year | 5-Year | 7-Year | 10-Year | 15-Year | 20-Year | |
| Year 1 | 33.33% | 20.00% | 14.29% | 10.00% | 5.00% | 3.750% |
| Year 2 | 44.45 | 32.00 | 24.49 | 18.00 | 9.50 | 7.219 |
| Year 3 | 14.81 | 19.20 | 17.49 | 14.40 | 8.55 | 6.677 |
| Year 4 | 7.41 | 11.52 | 12.49 | 11.52 | 7.70 | 6.177 |
| Year 5 | 11.52 | 8.93 | 9.22 | 6.93 | 5.713 | |
| Year 6 | 5.76 | 8.92 | 7.37 | 6.23 | 5.285 | |
| Year 7 | 8.93 | 6.55 | 5.90 | 4.888 | ||
| Year 8 | 4.46 | 6.55 | 5.90 | 4.522 | ||
| Year 9 | 6.56 | 5.91 | 4.462 | |||
| Year 10 | 6.55 | 5.90 | 4.461 | |||
| Year 11 | 3.28 | 5.91 | 4.462 | |||
| Year 12 | 5.90 | 4.461 | ||||
| Year 13 | 5.91 | 4.462 | ||||
| Year 14 | 5.90 | 4.461 | ||||
| Year 15 | 5.91 | 4.462 | ||||
| Year 16 | 2.95 | 4.461 | ||||
| Year 17 | 4.462 | |||||
| Year 18 | 4.461 | |||||
| Year 19 | 4.462 | |||||
| Year 20 | 4.461 | |||||
| Year 21 | 2.231 |


Step by Step Solution
There are 3 Steps involved in it
Step: 1

Get Instant Access to Expert-Tailored Solutions
See step-by-step solutions with expert insights and AI powered tools for academic success
Step: 2

Step: 3

Ace Your Homework with AI
Get the answers you need in no time with our AI-driven, step-by-step assistance
Get Started


