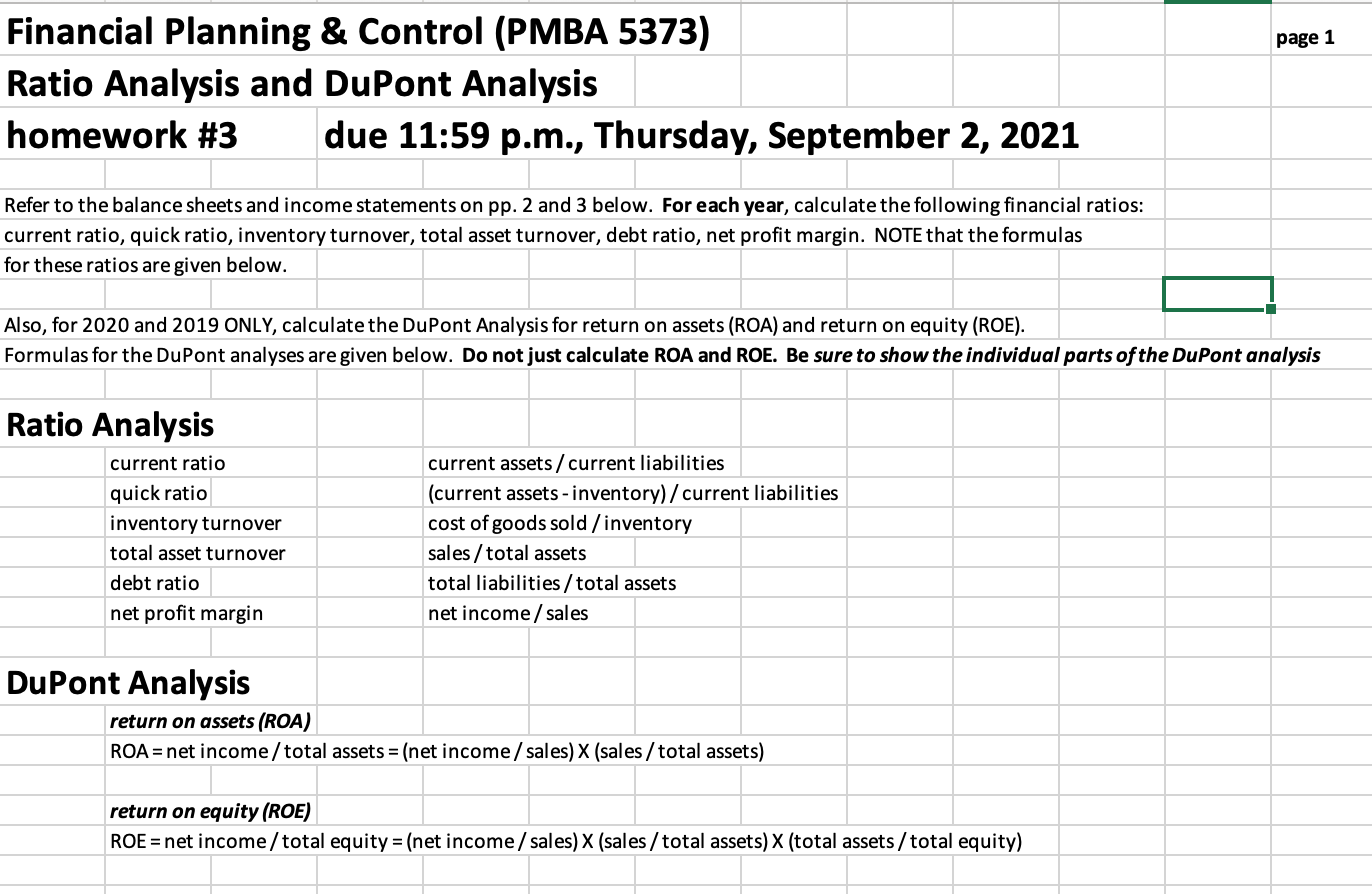
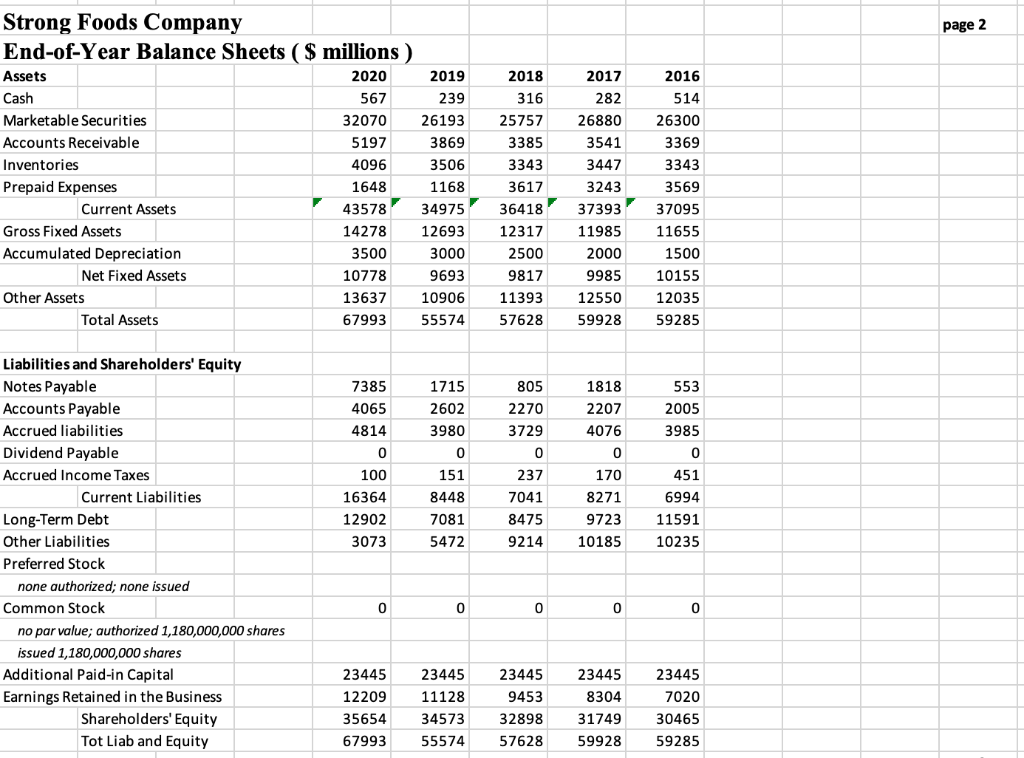
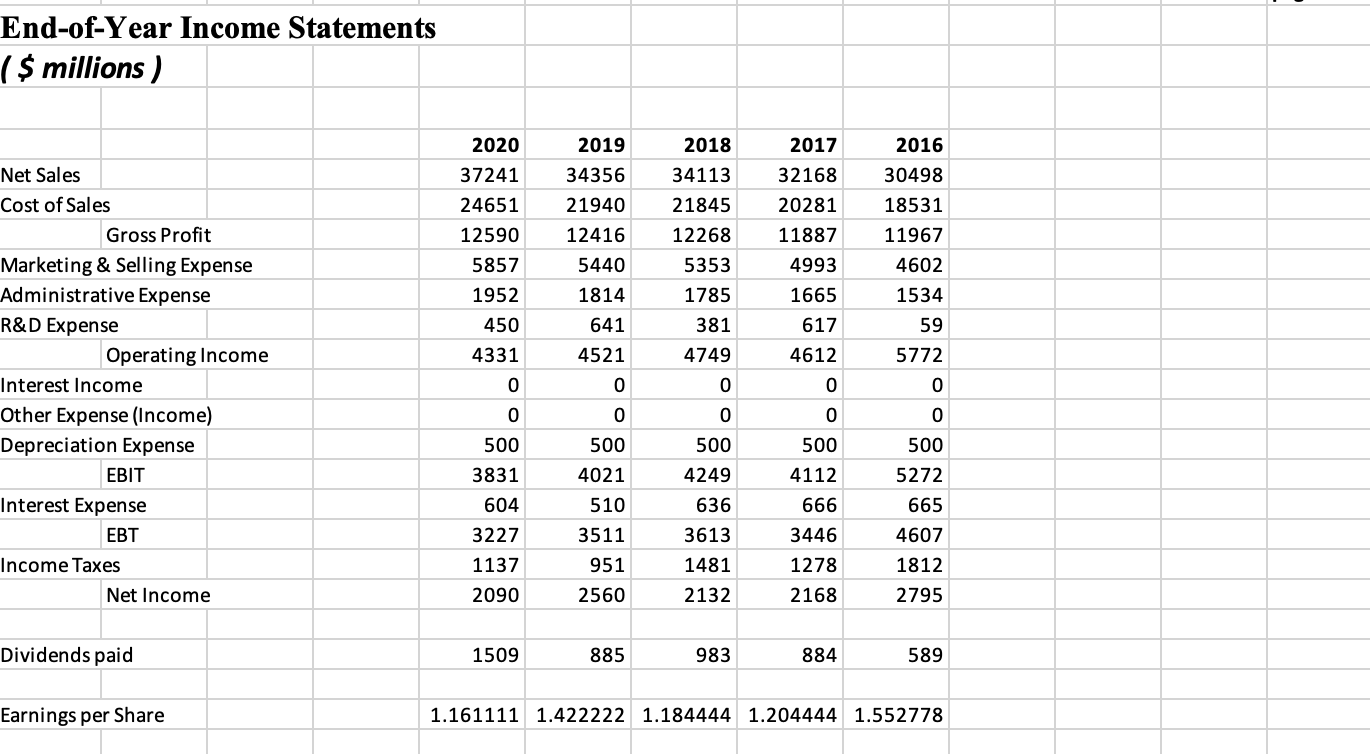
page 1 Financial Planning & Control (PMBA 5373) Ratio Analysis and DuPont Analysis homework #3 due 11:59 p.m., Thursday, September 2, 2021 Refer to the balance sheets and income statements on pp. 2 and 3 below. For each year, calculate the following financial ratios: current ratio, quick ratio, inventory turnover, total asset turnover, debt ratio, net profit margin. NOTE that the formulas for these ratios are given below. Also, for 2020 and 2019 ONLY, calculate the DuPont Analysis for return on assets (ROA) and return on equity (ROE). Formulas for the DuPont analyses are given below. Do not just calculate ROA and ROE. Be sure to show the individual parts of the DuPont analysis Ratio Analysis current ratio quick ratio inventory turnover total asset turnover debt ratio net profit margin current assets/ current liabilities (current assets - inventory)/current liabilities cost of goods sold /inventory sales / total assets total liabilities / total assets net income / sales DuPont Analysis return on assets (ROA) ROA = net income /total assets = (net income / sales) X (sales / total assets) return on equity (ROE) ROE = net income/total equity = (net income / sales) X (sales / total assets) X (total assets/total equity) page 2 Strong Foods Company End-of-Year Balance Sheets ( $ millions ) Assets Cash Marketable Securities Accounts Receivable Inventories Prepaid Expenses Current Assets Gross Fixed Assets Accumulated Depreciation Net Fixed Assets Other Assets Total Assets 2020 567 32070 5197 4096 1648 43578 14278 3500 10778 13637 67993 2019 239 26193 3869 3506 1168 34975 12693 3000 9693 10906 55574 2018 316 25757 3385 3343 3617 36418 12317 2500 9817 11393 57628 2017 282 26880 3541 3447 3243 37393 11985 2000 9985 12550 59928 2016 514 26300 3369 3343 3569 37095 11655 1500 10155 12035 59285 1715 7385 4065 4814 2602 1818 2207 4076 553 2005 3985 3980 0 0 805 2270 3729 0 237 7041 8475 9214 0 151 8448 7081 5472 100 16364 12902 3073 0 170 8271 9723 10185 451 6994 11591 10235 Liabilities and Shareholders' Equity Notes Payable Accounts Payable Accrued liabilities Dividend Payable Accrued Income Taxes Current Liabilities Long-Term Debt Other Liabilities Preferred Stock none authorized; none issued Common Stock no par value; authorized 1,180,000,000 shares issued 1,180,000,000 shares Additional Paid-in Capital Earnings Retained in the Business Shareholders' Equity Tot Liab and Equity 0 0 0 0 0 23445 8304 23445 12209 35654 67993 23445 11128 34573 55574 23445 9453 32898 57628 23445 7020 30465 59285 31749 59928 End-of-Year Income Statements ( $ millions ) 2020 2019 Net Sales 37241 24651 12590 5857 1952 450 4331 0 34356 21940 12416 5440 1814 641 4521 2018 34113 21845 12268 5353 1785 381 2017 32168 20281 11887 4993 1665 617 2016 30498 18531 11967 4602 1534 4749 4612 59 5772 0 0 0 0 Cost of Sales Gross Profit Marketing & Selling Expense Administrative Expense R&D Expense Operating Income Interest Income Other Expense (Income) Depreciation Expense EBIT Interest Expense Income Taxes Net Income 0 0 0 0 0 500 500 500 500 3831 604 5272 4249 636 4112 666 665 500 4021 510 3511 951 2560 3227 1137 3613 1481 2132 3446 1278 2168 4607 1812 2795 2090 Dividends paid 1509 885 983 884 589 Earnings per Share 1.161111 1.422222 1.184444 1.204444 1.552778