Page 2 of 8 (d) The residuals for a complete data set are shown below, and r for the least squares MSTr = MSE =
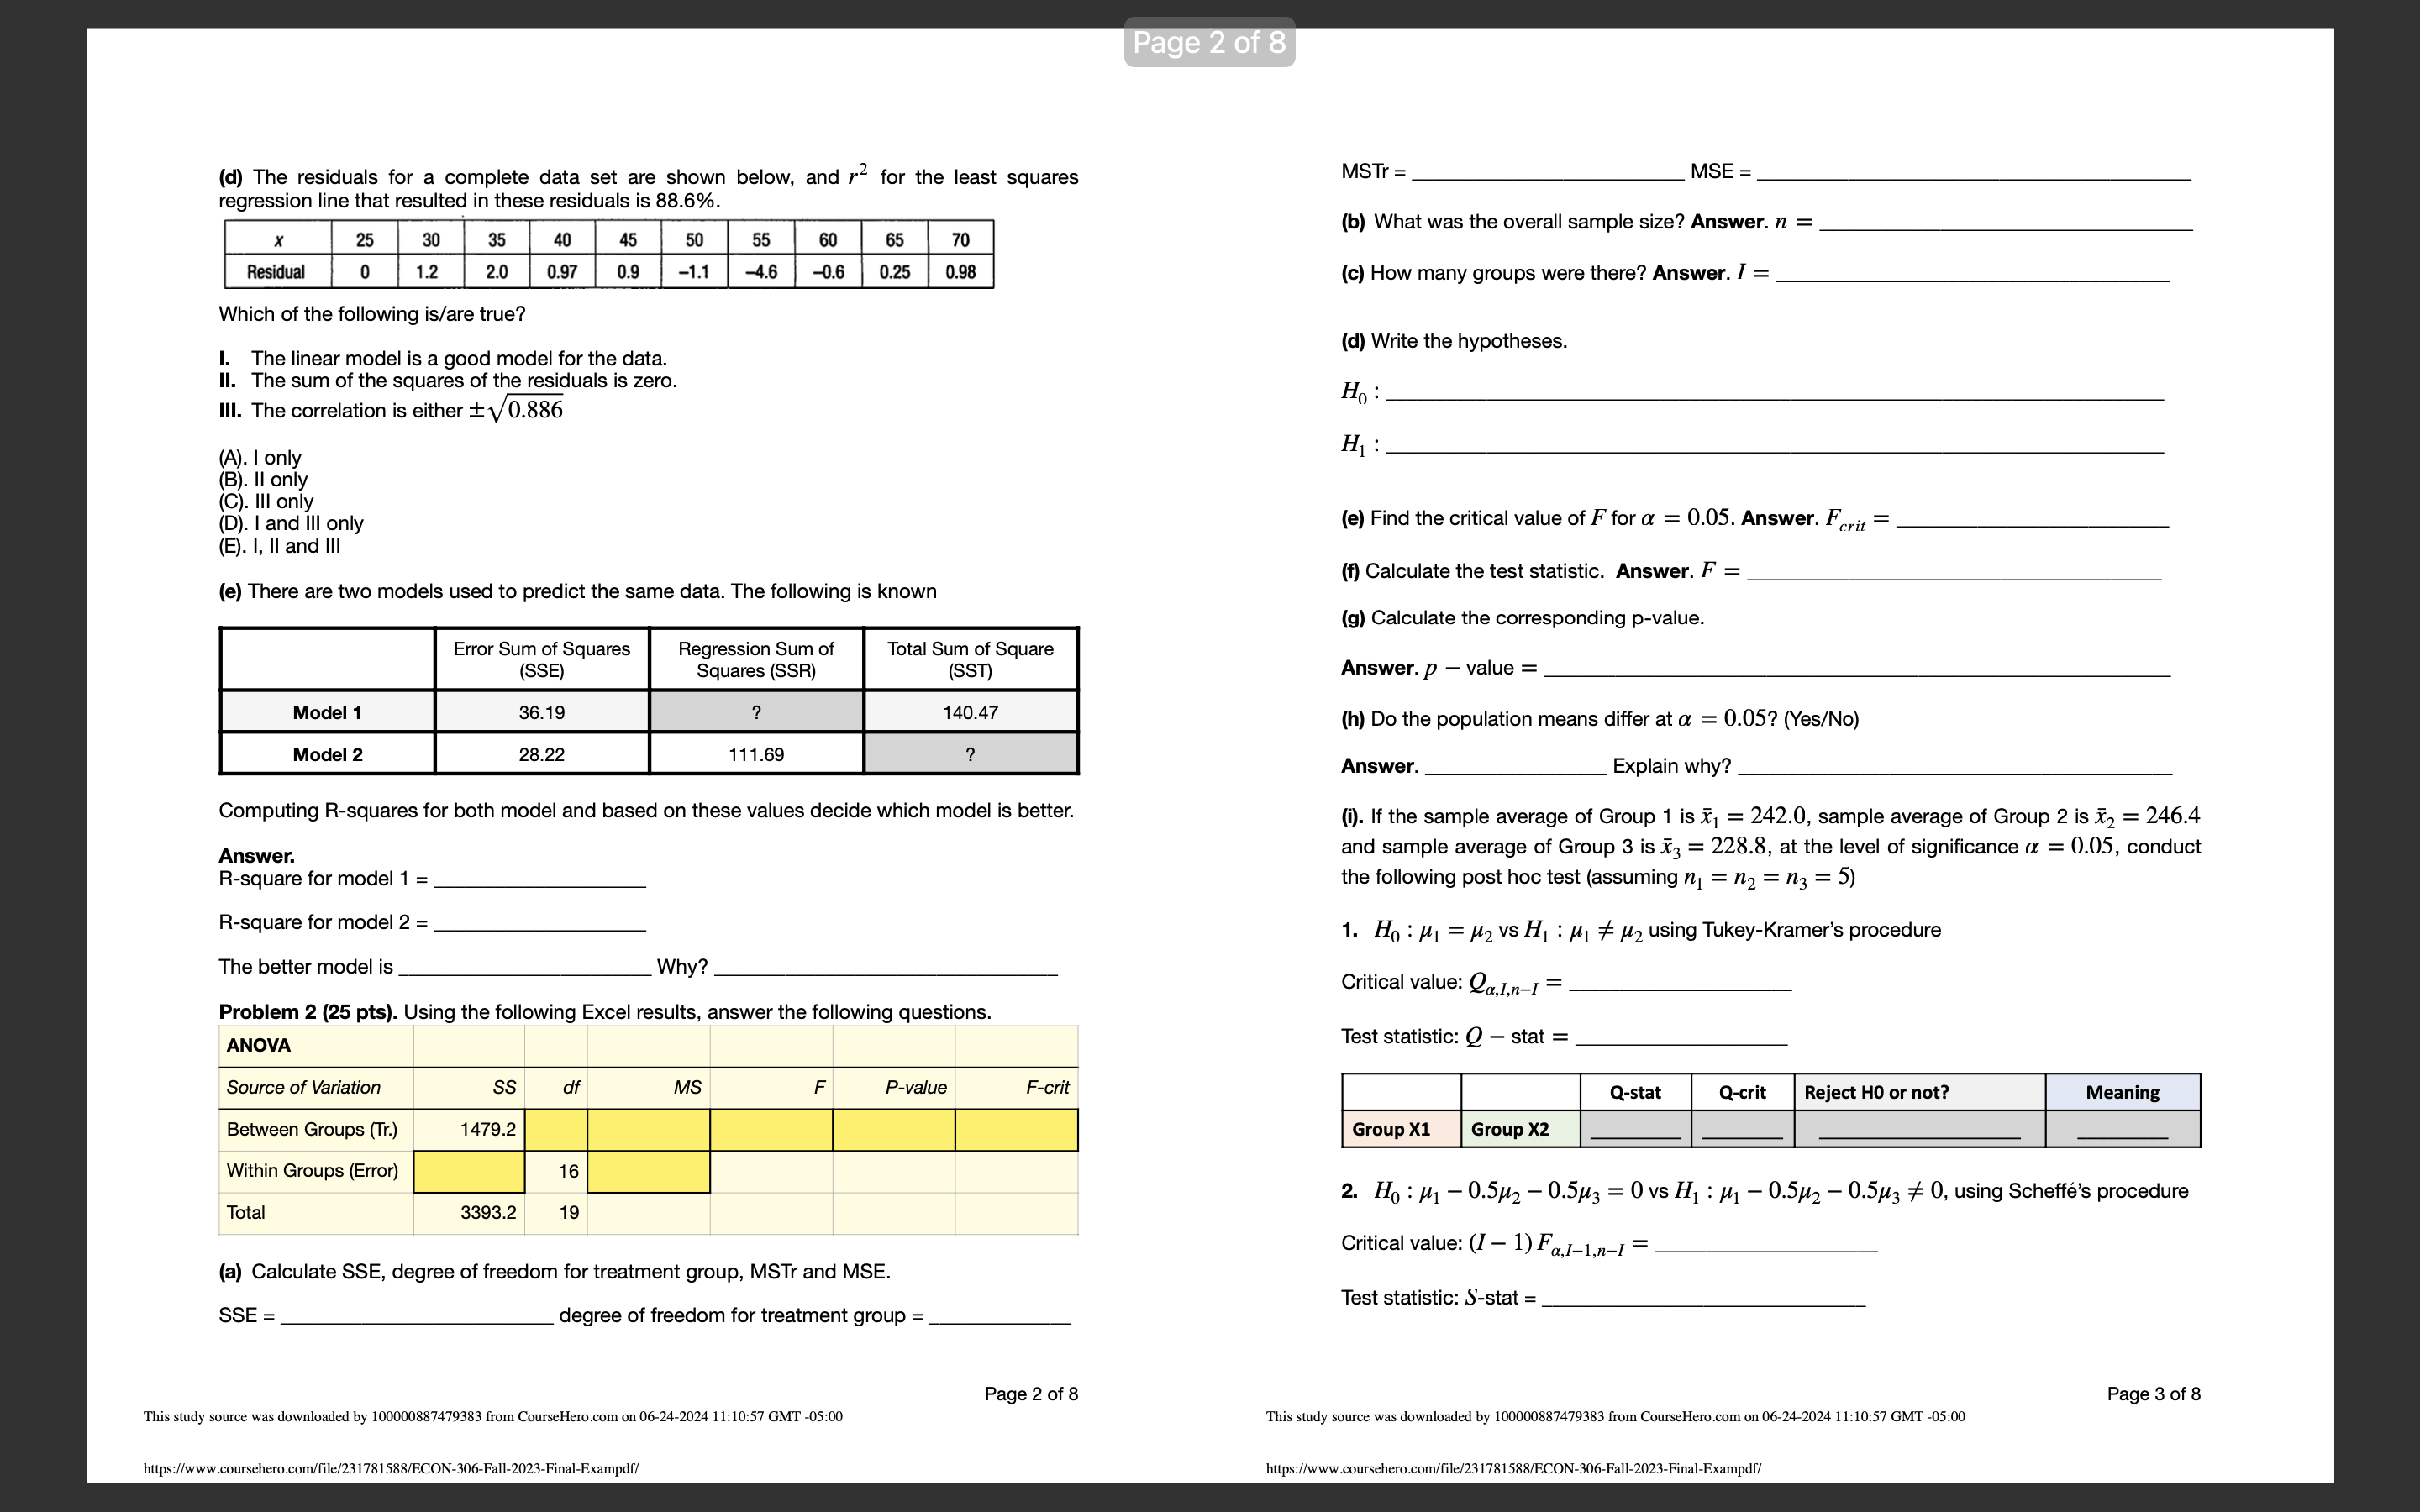
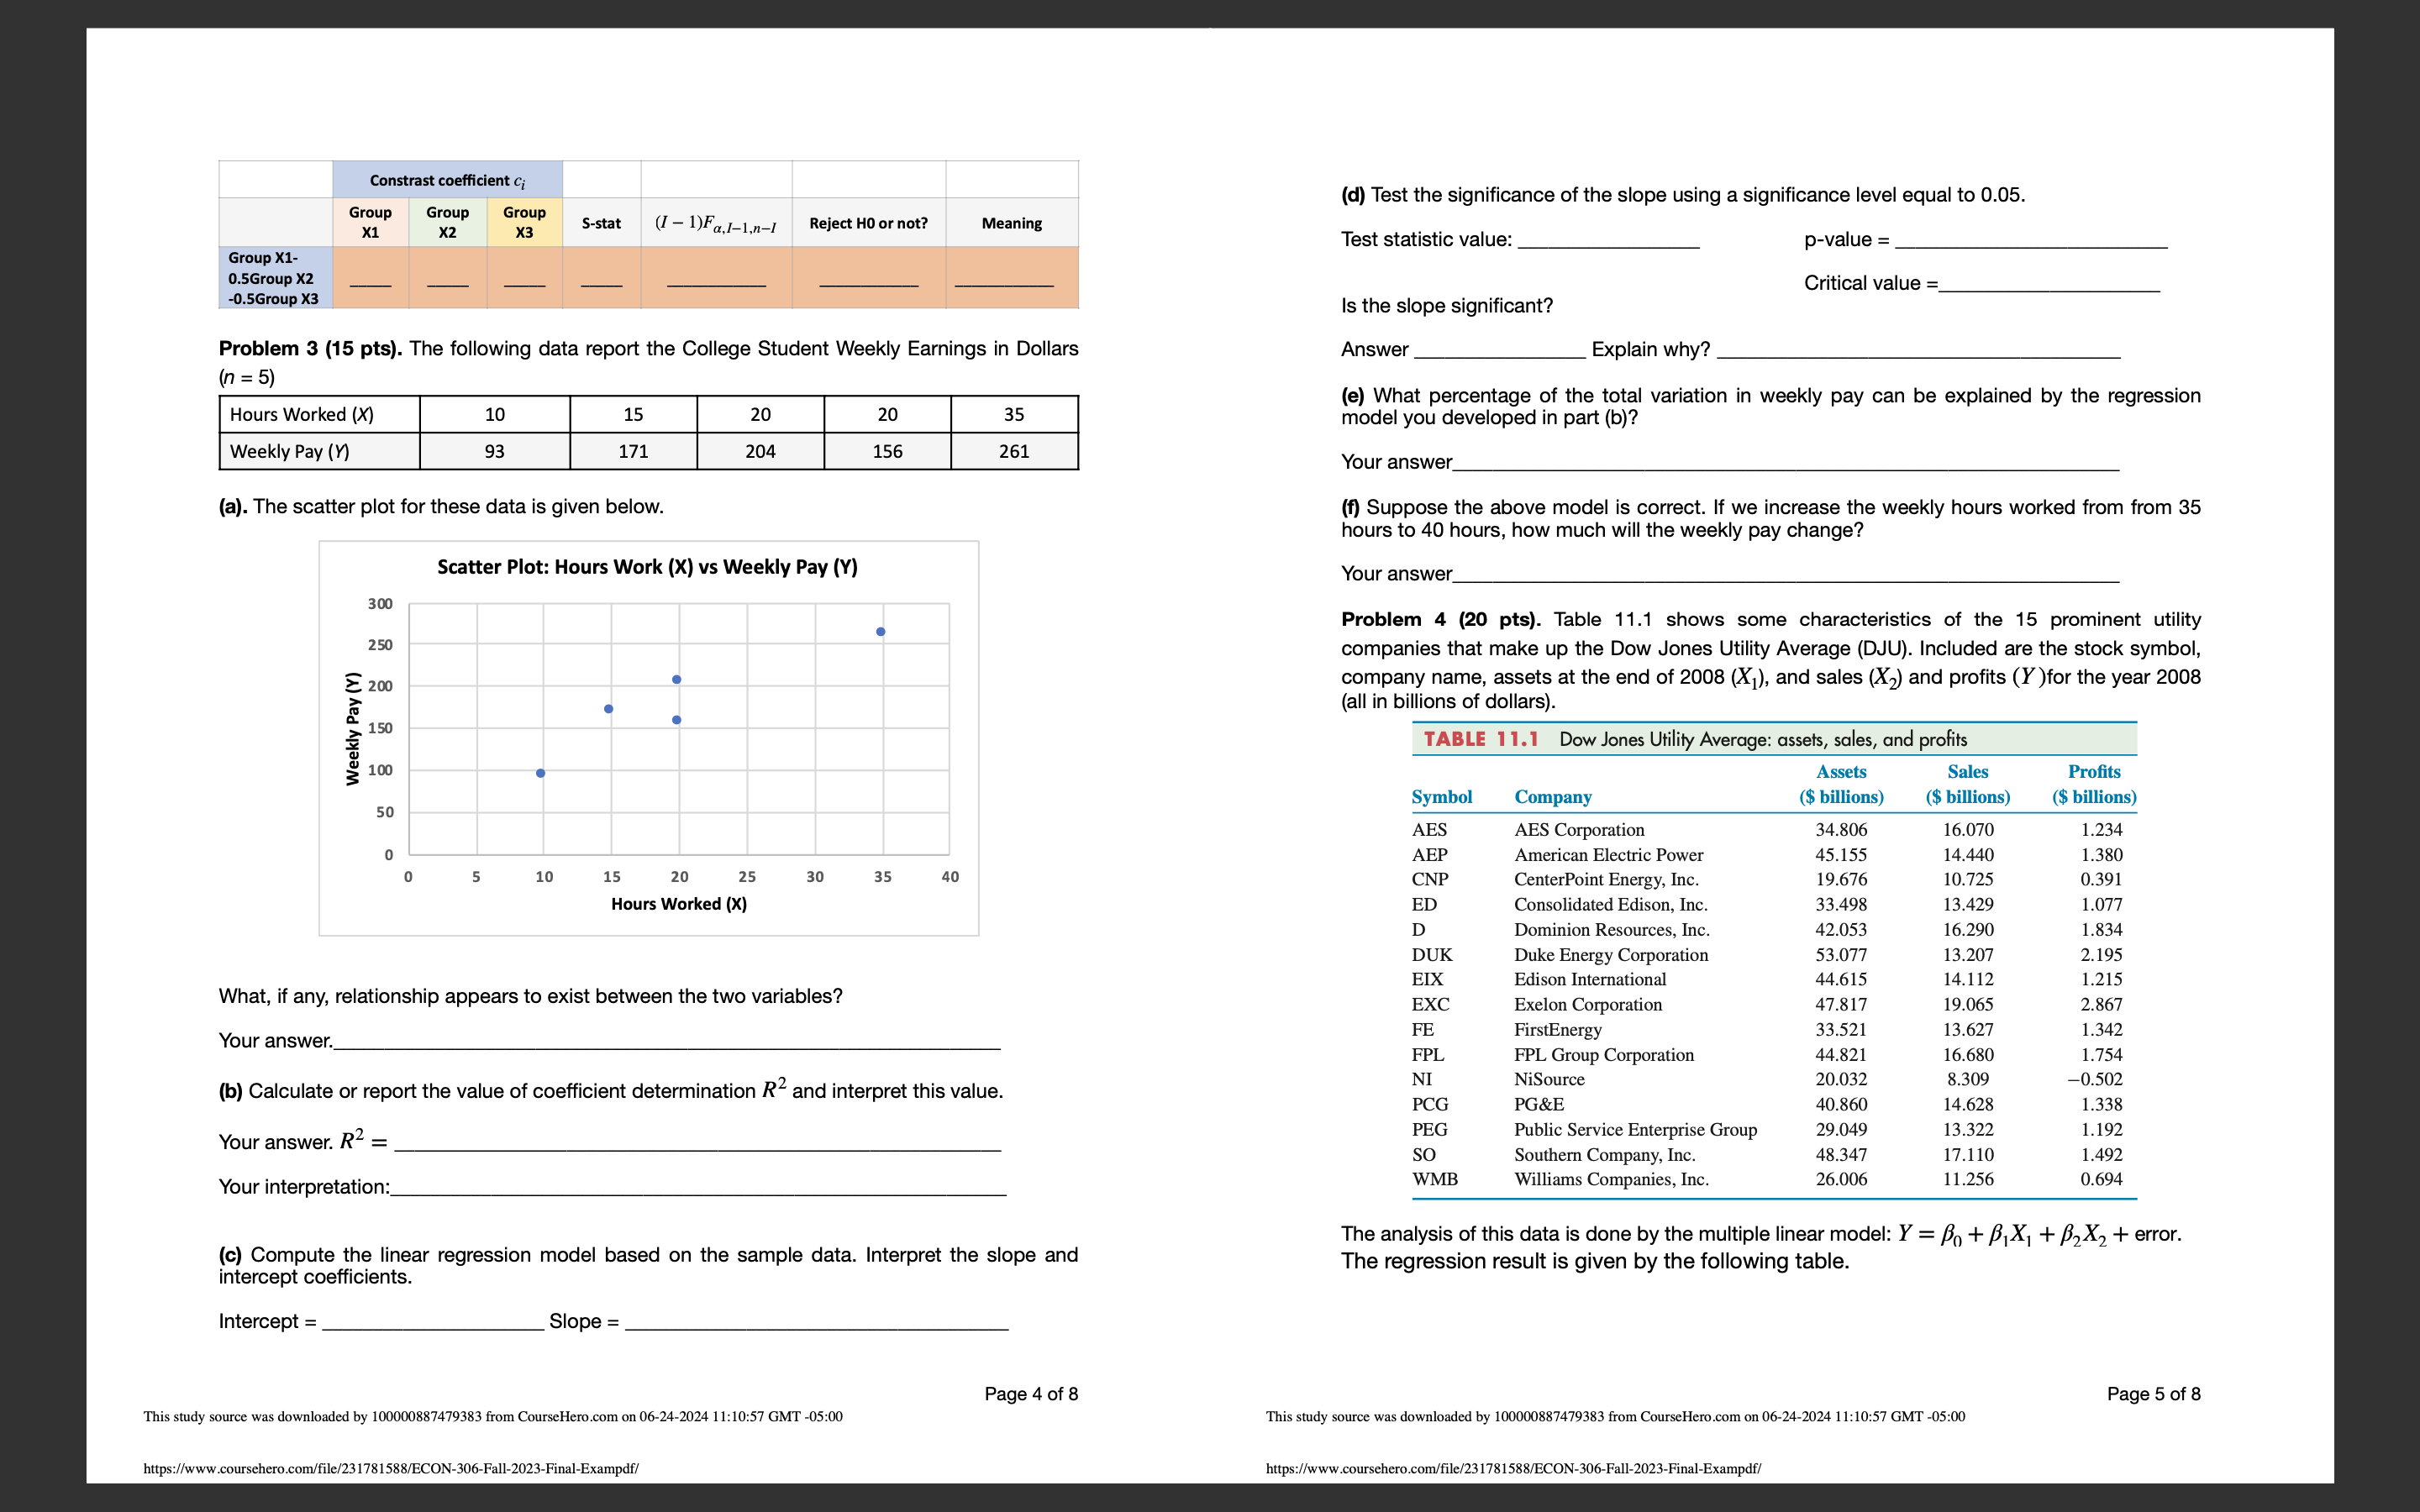
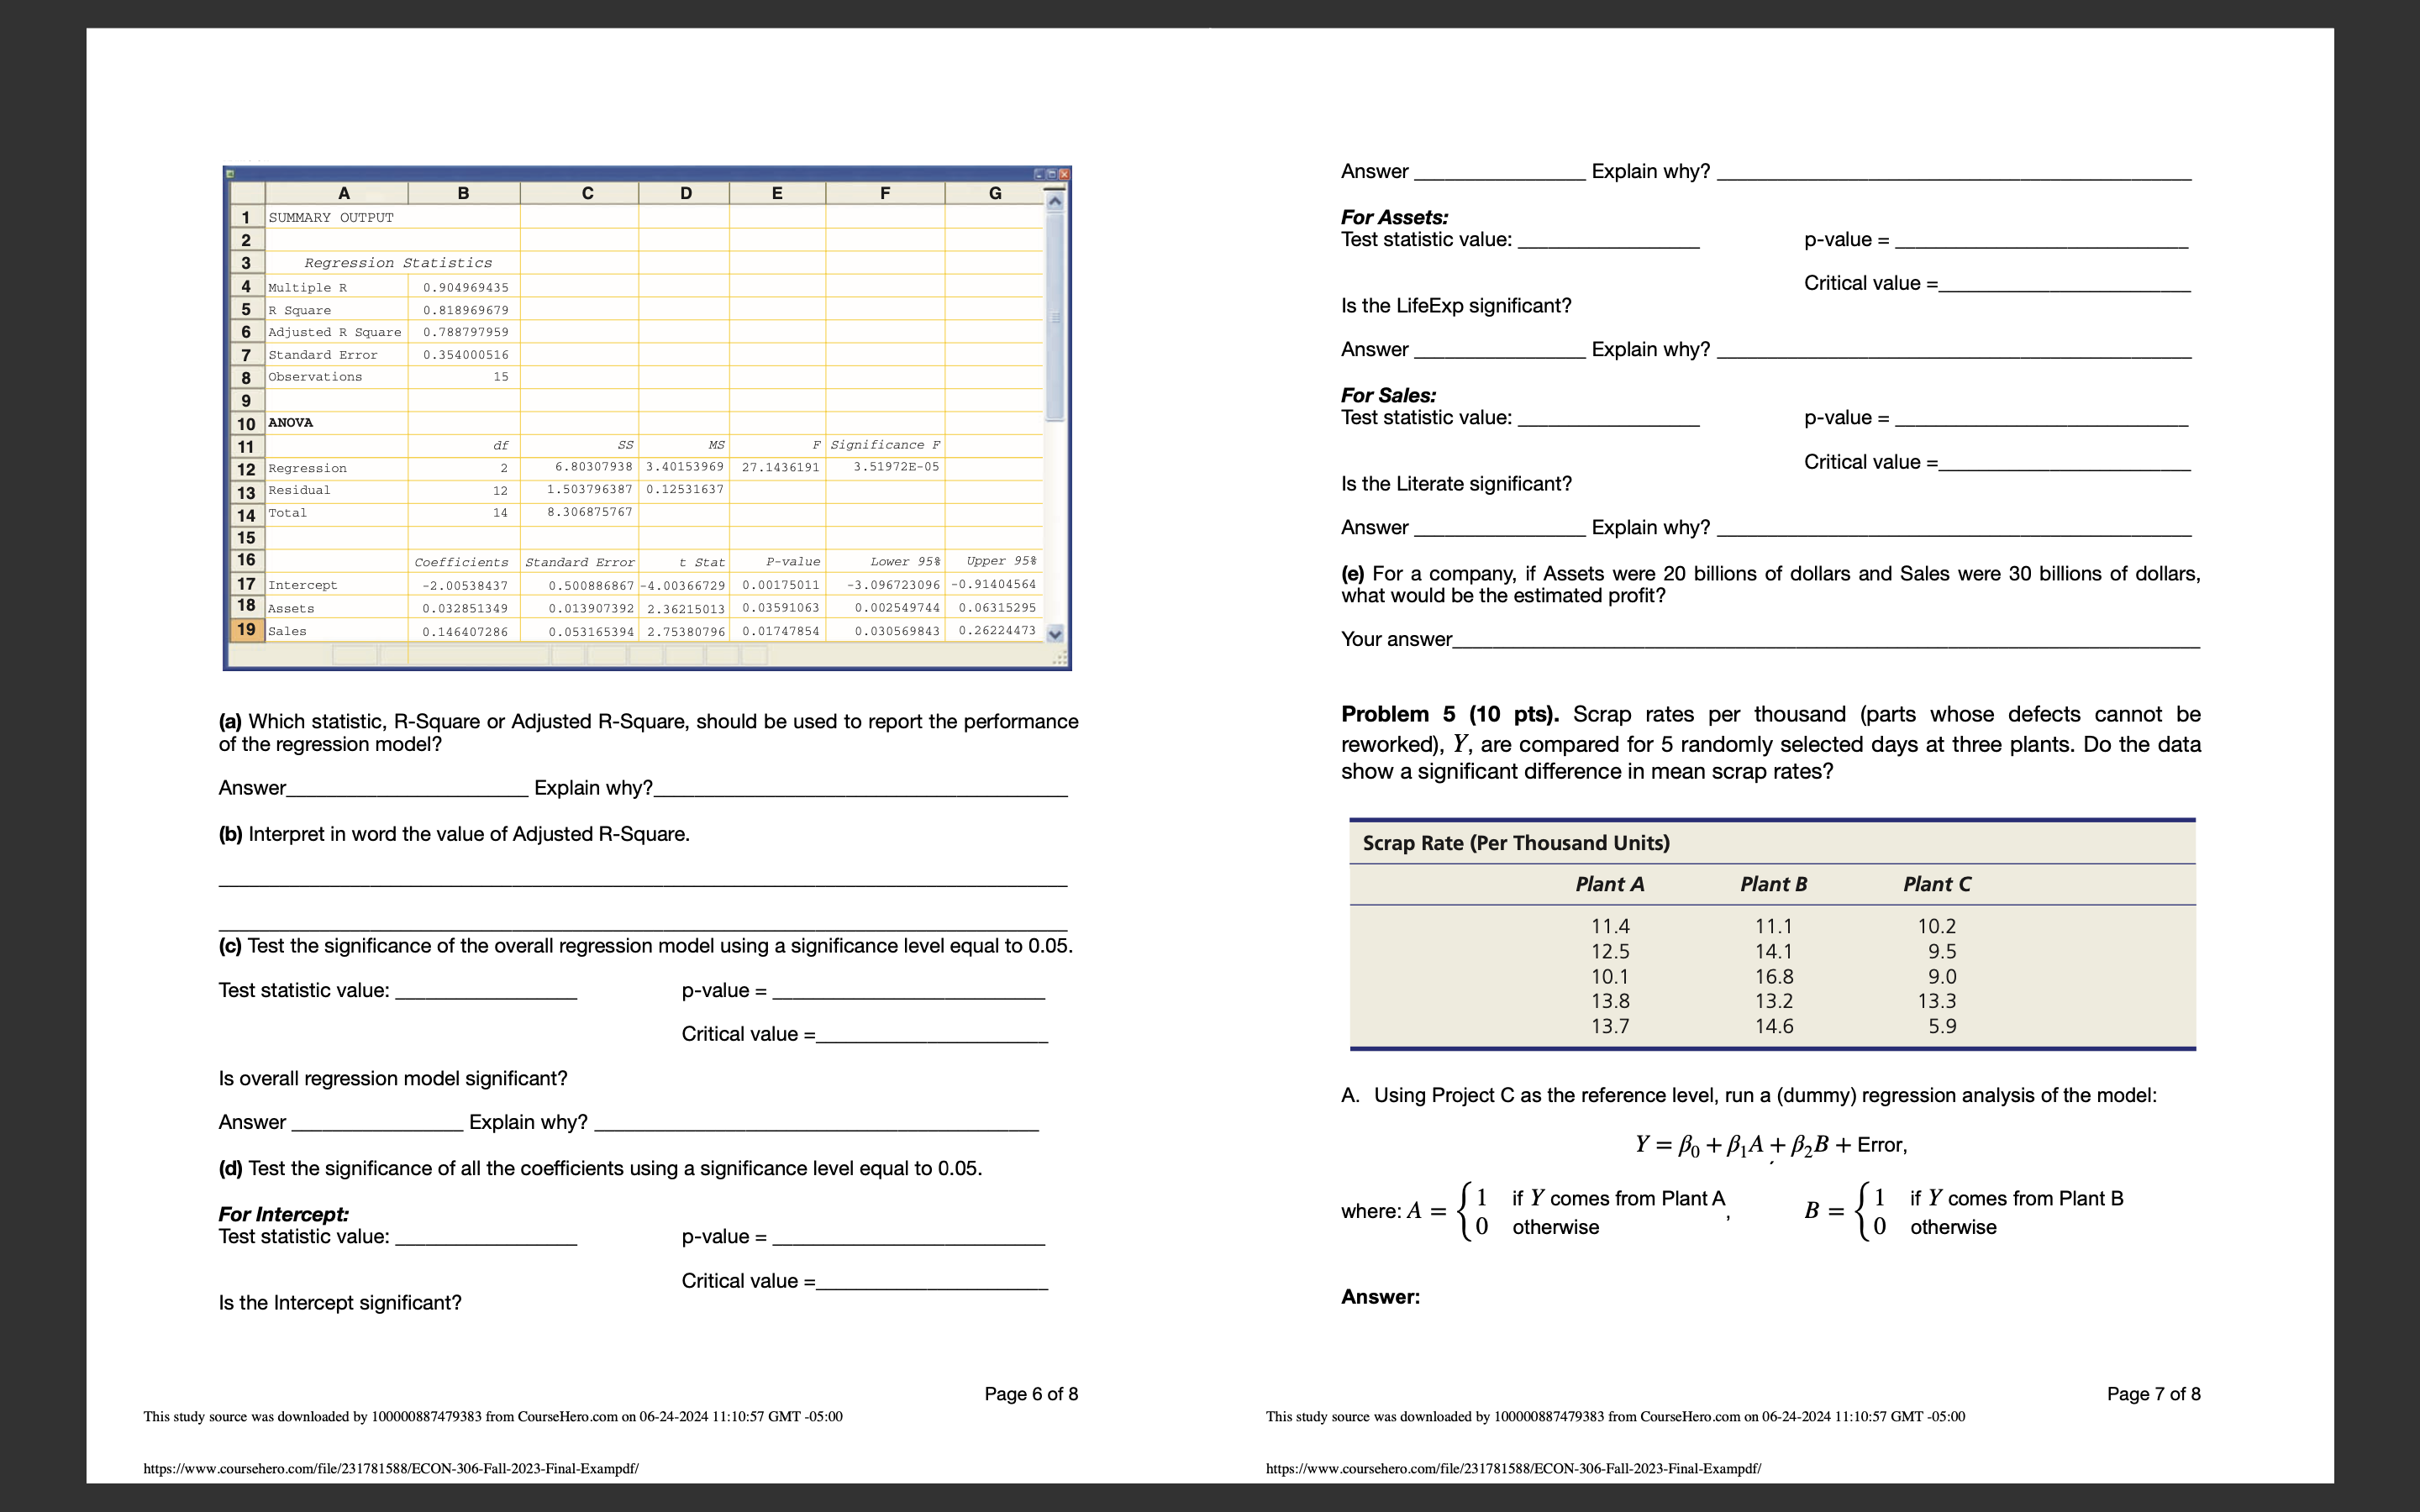
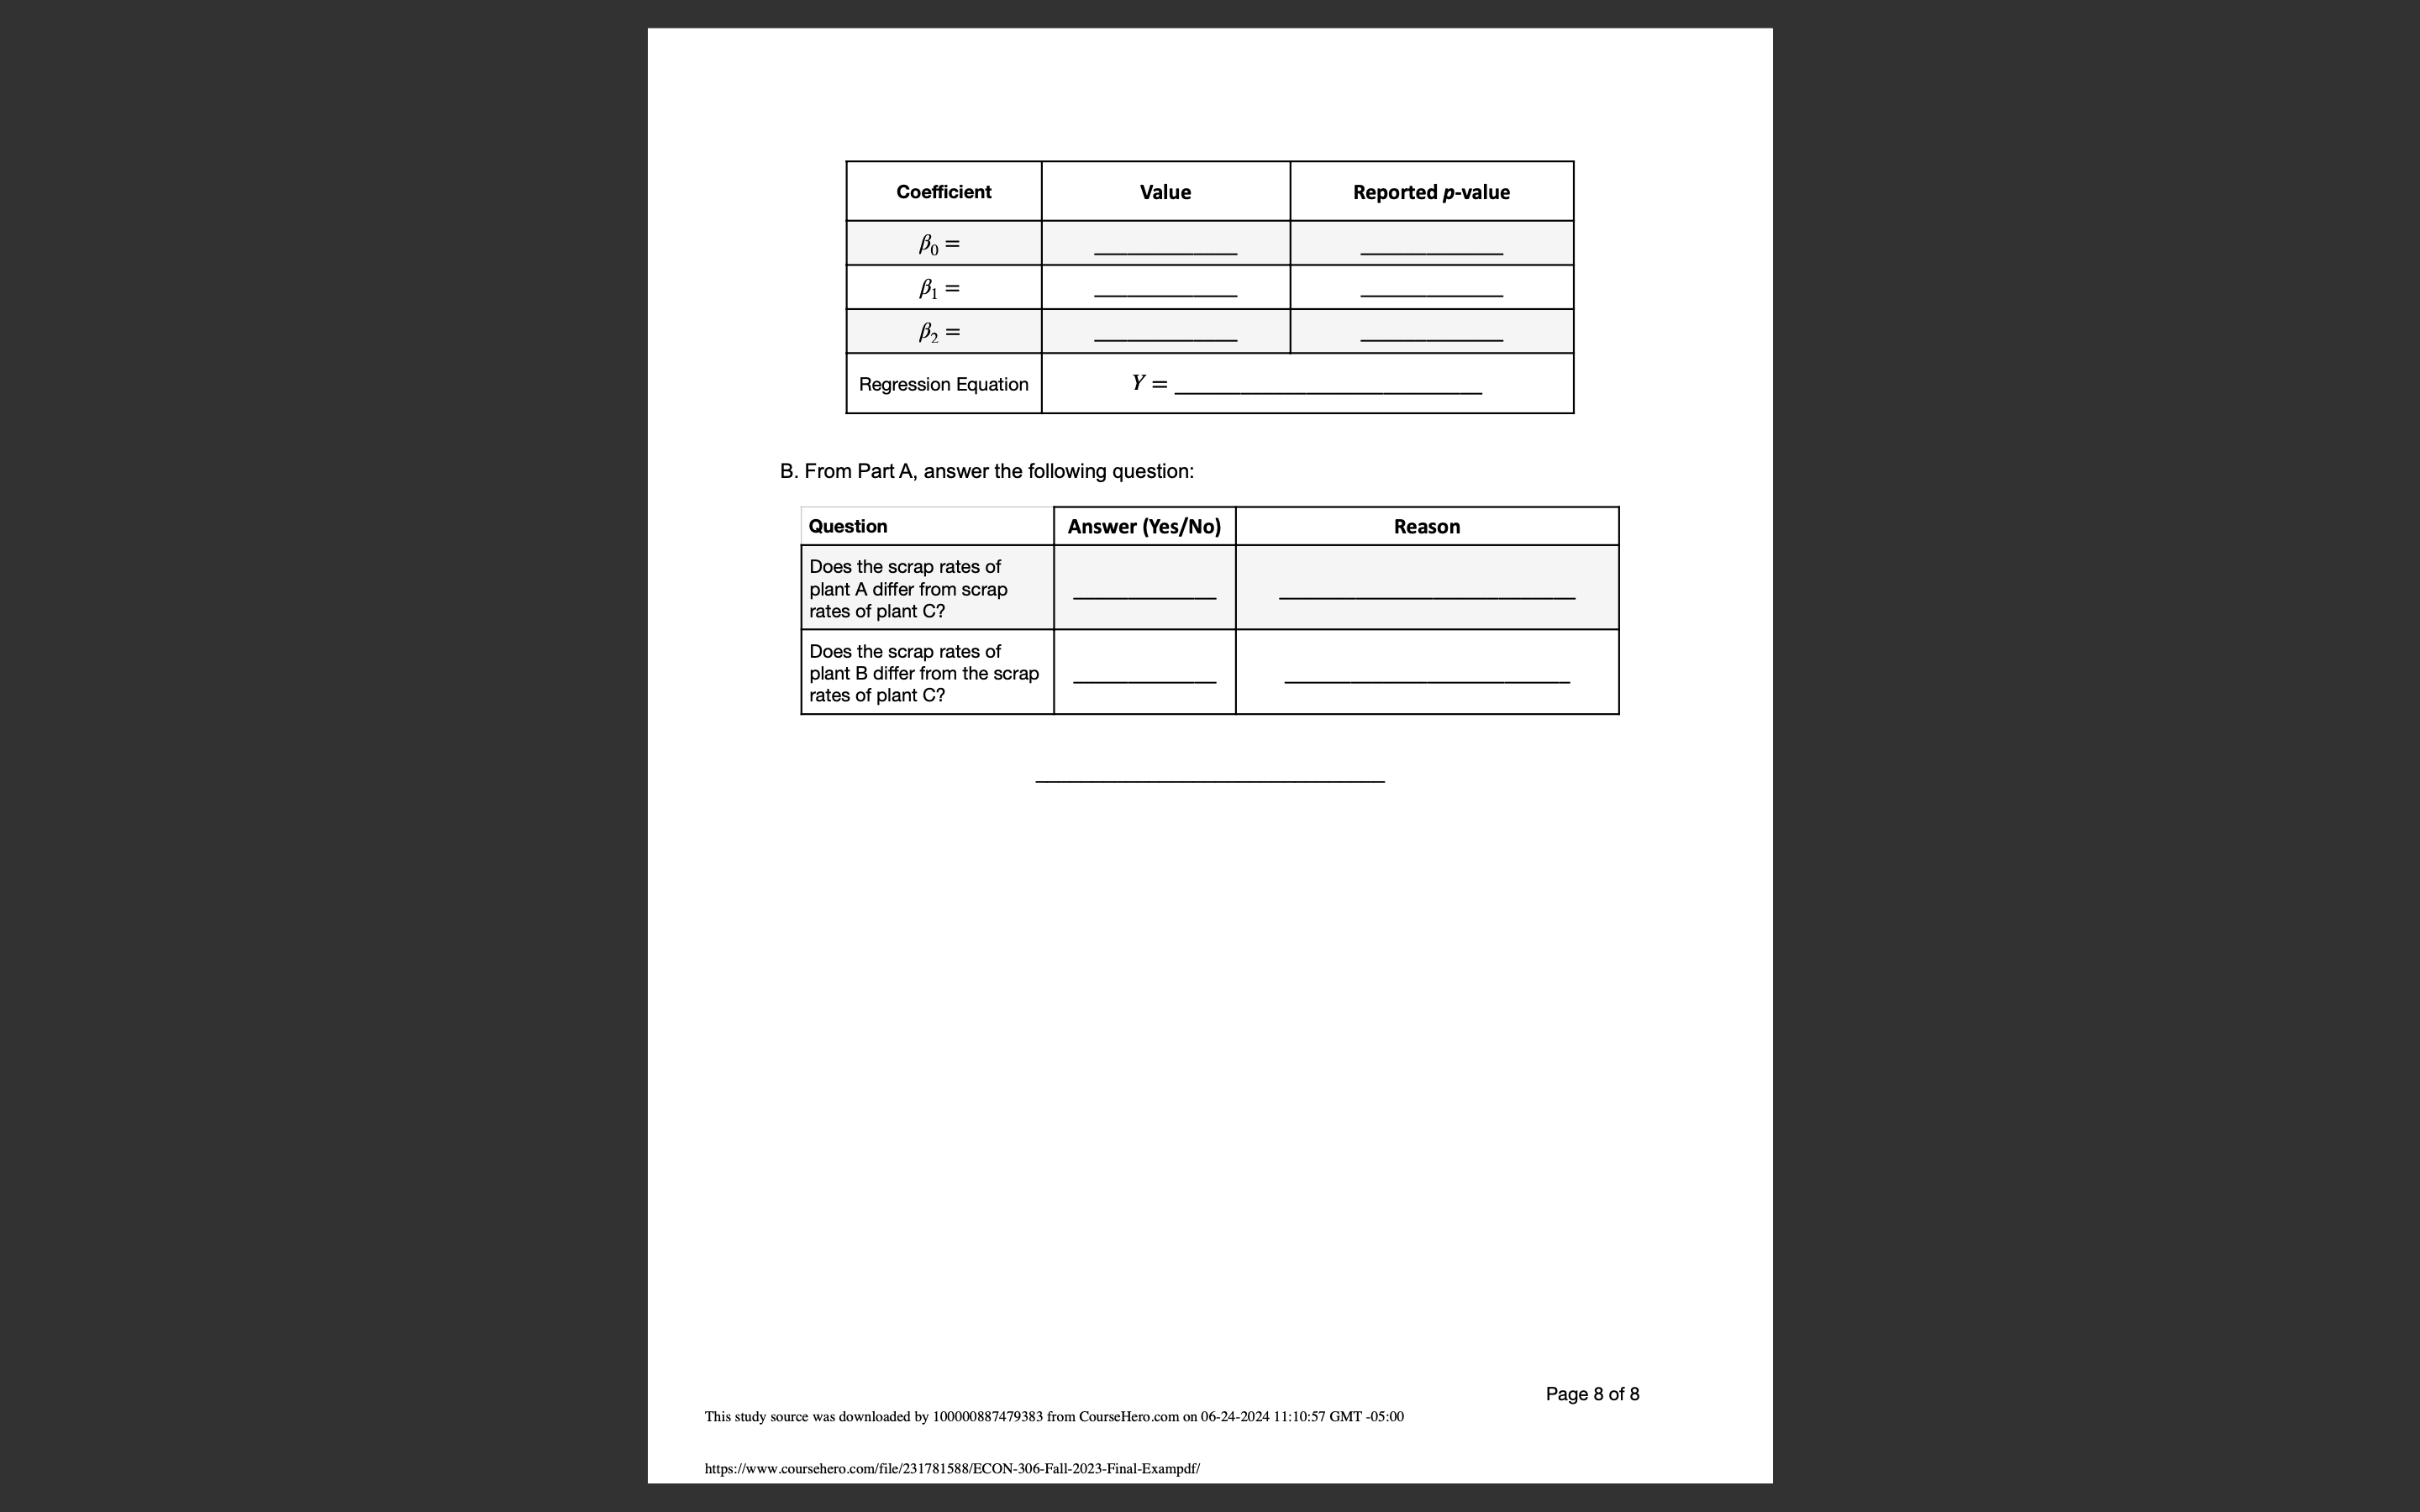
Page 2 of 8 (d) The residuals for a complete data set are shown below, and r for the least squares MSTr = MSE = regression line that resulted in these residuals is 88.6%. (b) What was the overall sample size? Answer. n = X 25 30 35 40 45 50 55 60 65 70 Residual 0 1.2 2.0 0.97 0.9 -1.1 -4.6 -0.6 0.25 0.98 (c) How many groups were there? Answer. I = Which of the following is/are true? (d) Write the hypotheses. I. The linear model is a good model for the data. II. The sum of the squares of the residuals is zero. Ho : Ill. The correlation is either # V0.886 (A). I only H : (B). II only C). Ill only D). I and Ill only (e) Find the critical value of F for a = 0.05. Answer. Forit = (E). I, II and III (f) Calculate the test statistic. Answer. F = (e) There are two models used to predict the same data. The following is known (g) Calculate the corresponding p-value. Error Sum of Squares Regression Sum of Total Sum of Square (SSE Squares (SSR) (SST) Answer. p - value = Model 1 36.19 140.47 (h) Do the population means differ at a = 0.05? (Yes/No) Model 2 28.22 111.69 Answer. Explain why? Computing R-squares for both model and based on these values decide which model is better. (i). If the sample average of Group 1 is x1 = 242.0, sample average of Group 2 is X2 = 246.4 Answer. and sample average of Group 3 is x3 = 228.8, at the level of significance a = 0.05, conduct R-square for model 1 = the following post hoc test (assuming n = n2 = n3 = 5) R-square for model 2 = 1. Ho : M1 = M2 VS H1 : Mi # M2 using Tukey-Kramer's procedure The better model is Why? Critical value: 2a,I,n-1 = Problem 2 (25 pts). Using the following Excel results, answer the following questions. ANOVA Test statistic: Q - stat = Source of Variation SS MS F P-value F-crit Q-stat Q-crit ect HO or not? Meaning Between Groups (Tr.) 1479.2 Group X1 Group X2 Within Groups (Error) 6 2. Ho : M1 - 0.5/2 - 0.5/3 = 0 vs H1 : M1 - 0.5/2 - 0.5/3 # 0, using Scheffe's procedure Total 3393.2 19 Critical value: (1 - 1) Fa,1-1,n-1 = (a) Calculate SSE, degree of freedom for treatment group, MSTr and MSE. Test statistic: S-stat = SSE = degree of freedom for treatment group = Page 2 of 8 Page 3 of 8 This study source was downloaded by 100000887479383 from CourseHero.com on 06-24-2024 11:10:57 GMT -05:00 This study source was downloaded by 100000887479383 from CourseHero.com on 06-24-2024 11:10:57 GMT -05:00 https://www.coursehero.com/file/231781588/ECON-306-Fall-2023-Final-Exampdf/ https://www.coursehero.com/file/231781588/ECON-306-Fall-2023-Final-Exampdf/Constrast coefficient ci (d) Test the significance of the slope using a significance level equal to 0.05. Group Group Group X1 X2 X3 S-stat (1 - 1)Fa,1-1.n-1 Reject HO or not? Meaning Test statistic value: p-value = Group X1- 0.5Group X2 Critical value = -0.5Group X3 he slope significant? Problem 3 (15 pts). The following data report the College Student Weekly Earnings in Dollars Answer Explain why? (n = 5 (e) What percentage of the total variation in weekly pay can be explained by the regression Hours Worked (X) 10 15 20 20 35 model you developed in part (b)? Weekly Pay ()) 93 171 204 156 261 Your answer (a). The scatter plot for these data is given below. (f) Suppose the above model is correct. If we increase the weekly hours worked from from 35 hours to 40 hours, how much will the weekly pay change? Scatter Plot: Hours Work (X) vs Weekly Pay (Y) Your answer 300 Problem 4 (20 pts). Table 11.1 shows some characteristics of the 15 prominent utility 250 companies that make up the Dow Jones Utility Average (DJU). Included are the stock symbol, company name, assets at the end of 2008 (X,), and sales (X2) and profits (Y )for the year 2008 all in billions of dollars). : 150 Weekly Pay TABLE 11.1 Dow Jones Utility Average: assets, sales, and profit Assets Sales Profits Symbol Company $ billions) $ billions) $ billions) 50 AE AES Corporation 34.80 16.070 1.234 0 AEP American Electric Power 45.155 14.440 .380 0 10 15 20 25 30 35 40 CNP CenterPoint Energy, Inc. 19.676 10.725 0.391 Hours Worked (X) ED Consolidated Edison, Inc. 33.498 13.429 1.07 D Dominion Resources, Inc. 42.053 16.290 1.834 DUK Duke Energy Corporation 53.077 13.207 2.195 EIX Edison International 44.615 14.11 1.215 What, if any, relationship appears to exist between the two variables? EXC Exelon Corporation 47.817 19.065 2.867 Your answer. FE FirstEnergy 33.521 13.627 1.342 FPL FPL Group Corporation 44.821 16.680 1.754 NI (b) Calculate or report the value of coefficient determination R and interpret this value. NiSource 20.032 8.309 -0.502 PCC PG&E 40.860 14.628 1.338 Your answer. R2 = PEG Public Service Enterprise Group 29.049 13.322 1.192 SO Southern Company, Inc 48.347 17.110 1.492 Your interpretation: WMB Williams Companies, Inc 26.006 11.256 0.694 The analysis of this data is done by the multiple linear model: Y = P, + B,X, + B2X2 + error. (c) Compute the linear regression model based on the sample data. Interpret the slope and The regression result is given by the following table. intercept coefficients. Intercept = Slope = Page 4 of 8 Page 5 of 8 This study source was downloaded by 100000887479383 from CourseHero.com on 06-24-2024 11:10:57 GMT -05:00 This study source was downloaded by 100000887479383 from CourseHero.com on 06-24-2024 11:10:57 GMT -05:00 https://www.coursehero.com/file/231781588/ECON-306-Fall-2023-Final-Exampdf/ https://www.coursehero.com/file/231781588/ECON-306-Fall-2023-Final-Exampdf/Answer Explain why? A B C D E F G 1 SUMMARY OUTPUT For Assets: Test statistic value: p-value = 3 Regression Statistics 4 Multiple R 0. 904969435 Critical value = 5 R Square 0. 818969679 Is the LifeExp significant? 6 Adjusted R Square 0.788797959 7 Standard Error 0 . 354000516 Answer Explain why? Observations 15 9 For Sales: 10 ANOVA Test statistic value: p-value = 11 df SS MS F Significance F 12 Regression 6. 80307938 3.40153969 27. 1436191 3.51972E-05 Critical value =_ 13 Residual 12 1 . 503796387 0.12531637 Is the Literate significant? 14 Total 14 8. 306875767 15 Answer Explain why? 16 Coefficients Standard Error t Stat P-value Lower 958 Upper 958 17 Intercept -2. 00538437 0. 500886867 -4. 00366729 0. 00175011 -3. 096723096 -0. 91404564 (e) For a company, if Assets were 20 billions of dollars and Sales were 30 billions of dollars, 18 Assets 0. 032851349 0. 013907392 2. 36215013 0. 03591063 0. 002549744 0. 06315295 what would be the estimated profit? 19 sales 0. 146407286 0. 053165394 2. 75380796 0. 01747854 0. 030569843 0.26224473 Your answer (a) Which statistic, R-Square or Adjusted R-Square, should be used to report the performance Problem 5 (10 pts). Scrap rates per thousand (parts whose defects cannot be of the regression model? reworked), Y, are compared for 5 randomly selected days at three plants. Do the data show a significant difference in mean scrap rates? Answer Explain why? (b) Interpret in word the value of Adjusted R-Square. Scrap Rate (Per Thousand Units) Plant A Plant B Plant C 11.4 11.1 10.2 (c) Test the significance of the overall regression model using a significance level equal to 0.05. 12.5 14.1 9 .5 10.1 16.8 9.0 Test statistic value: p-value = 13.8 13.2 13.3 Critical value =_ 13.7 14.6 5.9 Is overall regression model significant? A. Using Project C as the reference level, run a (dummy) regression analysis of the model: Answer Explain why? Y = Bo + BIA + B2B + Error, (d) Test the significance of all the coefficients using a significance level equal to 0.05. For Intercept: where: A : if Y comes from Plant A if Y comes from Plant B Test statistic value: p-value = otherwise B = 10 otherwise Critical value =_ Is the Intercept significant? Answer: Page 6 of 8 Page 7 of 8 This study source was downloaded by 100000887479383 from CourseHero.com on 06-24-2024 11:10:57 GMT -05:00 This study source was downloaded by 100000887479383 from CourseHero.com on 06-24-2024 11:10:57 GMT -05:00 https://www.coursehero.com/file/231781588/ECON-306-Fall-2023-Final-Exampdf/ https://www.coursehero.com/file/231781588/ECON-306-Fall-2023-Final-Exampdf/Coefficient Value Reported p-value B2 = Regression Equation Y = B. From Part A, answer the following question: Question Answer (Yes/No) Reason Does the scrap rates of plant A differ from scrap rates of plant C? Does the scrap rates of plant B differ from the scrap rates of plant C? Page 8 of 8 This study source was downloaded by 100000887479383 from CourseHero.com on 06-24-2024 11:10:57 GMT -05:00 https://www.coursehero.com/file/231781588/ECON-306-Fall-2023-Final-Exampdf/
Step by Step Solution
There are 3 Steps involved in it
Step: 1
Get Instant Access to Expert-Tailored Solutions
See step-by-step solutions with expert insights and AI powered tools for academic success
Step: 2
Step: 3
Ace Your Homework with AI
Get the answers you need in no time with our AI-driven, step-by-step assistance