Answered step by step
Verified Expert Solution
Question
1 Approved Answer
Your best-friends have decided to open a cozy coffee shop in a busy commercial center in Kuwait in 2018. They have done extensive market
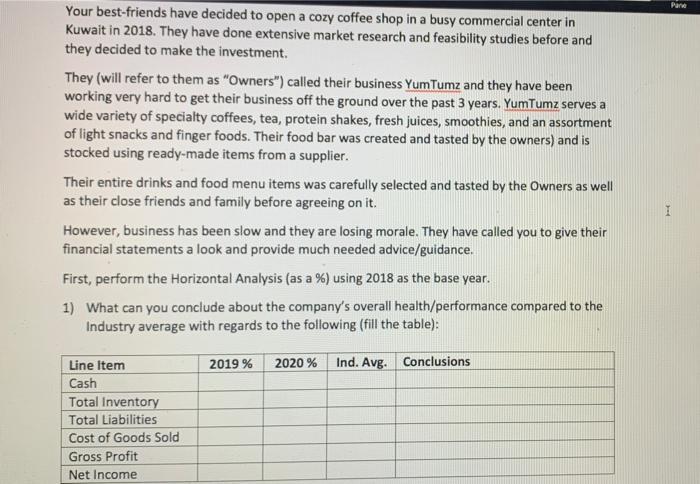
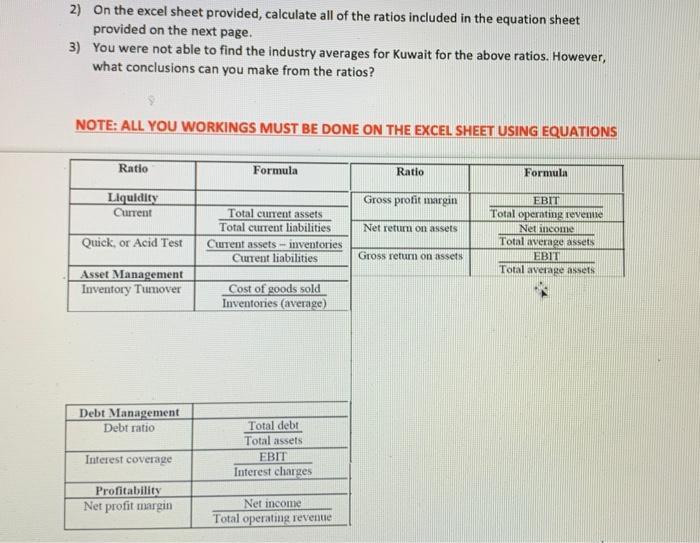
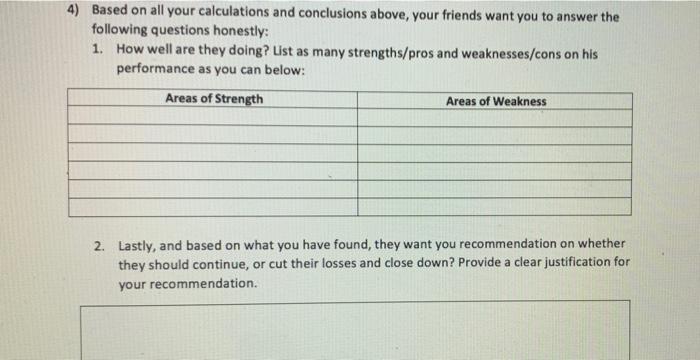
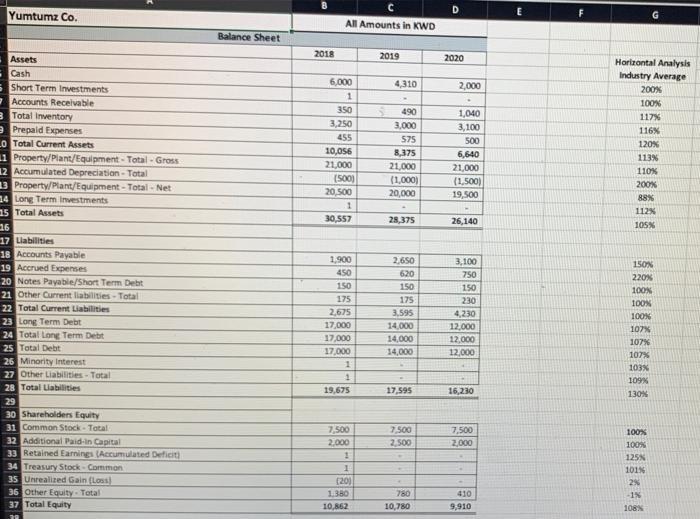
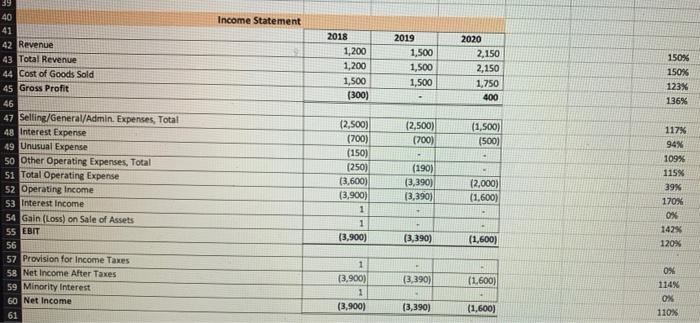
Your best-friends have decided to open a cozy coffee shop in a busy commercial center in Kuwait in 2018. They have done extensive market research and feasibility studies before and they decided to make the investment. They (will refer to them as Owners ) called their business Yum Tumz and they have been working very hard to get their business off the ground over the past 3 years. YumTumz serves a wide variety of specialty coffees, tea, protein shakes, fresh juices, smoothies, and an assortment of light snacks and finger foods. Their food bar was created and tasted by the owners) and is stocked using ready-made items from a supplier. Their entire drinks and food menu items was carefully selected and tasted by the Owners as well as their close friends and family before agreeing on it. However, business has been slow and they are losing morale. They have called you to give their financial statements a look and provide much needed advice/guidance. First, perform the Horizontal Analysis (as a %) using 2018 as the base year. 1) What can you conclude about the company s overall health/performance compared to the Industry average with regards to the following (fill the table): 2020 % Ind. Avg. Conclusions Line Item Cash Total Inventory Total Liabilities Cost of Goods Sold Gross Profit Net Income 2019 % Pane I 2) On the excel sheet provided, calculate all of the ratios included in the equation sheet provided on the next page. 3) You were not able to find the industry averages for Kuwait for the above ratios. However, what conclusions can you make from the ratios? NOTE: ALL YOU WORKINGS MUST BE DONE ON THE EXCEL SHEET USING EQUATIONS Ratio Liquidity Current Quick, or Acid Test Asset Management Inventory Tumover Debt Management Debt ratio Interest coverage Profitability Net profit margin Formula Total current assets Total current liabilities. Current assets-inventories Current liabilities Cost of goods sold Inventories (average) Total debt Total assets EBIT Interest charges Net income Total operating revenue Ratio Gross profit margin Net return on assets Gross return on assets Formula EBIT Total operating revenue Net income Total average assets EBIT Total average assets 4) Based on all your calculations and conclusions above, your friends want you to answer the following questions honestly: 1. How well are they doing? List as many strengths/pros and weaknesses/cons on his performance as you can below: Areas of Strength Areas of Weakness 2. Lastly, and based on what you have found, they want you recommendation on whether they should continue, or cut their losses and close down? Provide a clear justification for your recommendation. Yumtumz Co. Assets Cash Short Term Investments Accounts Receivable 3 Total Inventory 9 Prepaid Expenses LO Total Current Assets 11 Property/Plant/Equipment- Total-Gross 12 Accumulated Depreciation - Total 13 Property/Plant/Equipment- 34 Long Term Investments 15 Total Assets 16 17 Liabilities 18 Accounts Payable 19 Accrued Expenses 20 Notes Payable/Short Term Debt 21 Other Current liabilities-Total 22 Total Current Liabilities 23 Long Term Debt 24 Total Long Term Debt 25 Total Debt 26 Minority Interest 27 Other Liabilities-Total 28 Total Liabilities Total - Net 29 30 Shareholders Equity 31 Common Stock-Total- 32 Additional Paid-in Capital 33 Retained Earnings (Accumulated Deficit) 34 Treasury Stock-Common 35 Unrealized Gain (Loss) 36 Other Equity- Total 37 Total Equity 30 Balance Sheet 2018 All Amounts in KWD 6,000 1 350 3,250 455 10,056 21,000 (500) 20,500 1 30,557 1,900 450 150 175 2,675 17,000 17,000 17,000 1 1 19,675 7,500 2,000 1 1 (20) 1.380 10,862 2019 4,310 - 490 3,000 575 8,375 21,000 (1,000) 20,000 28,375 2,650 620 150 175 3,595 14,000 14,000 14,000 17,595 7,500 2,500 * 780 10,780 D 2020 2,000 1,040 3,100 500 6,640 21,000 (1,500) 19,500 26,140 3,100 750 150 230 4,230 12,000 12,000 12,000 16,230 7,500 2,000 C 410 9,910 E Horizontal Analysis Industry Average G 200% 100% 117% 116% 120% 113% 110% 200% 88% 112% 105% 150% 220% 100% 100% 100% 107% 107% 107% 103% 109 % 130% 100% 100% 125% 101% 2% -1% 108 % 39 40 41 42 Revenue 43 Total Revenue 44 Cost of Goods Sold 45 Gross Profit 46 47 Selling/General/Admin. Expenses, Total 48 Interest Expense 49 Unusual Expense 50 Other Operating Expenses, Total 51 Total Operating Expense 52 Operating Income 53 Interest Income 54 Gain (Loss) on Sale of Assets 55 EBIT 56 57 Provision for Income Taxes 58 Net Income After Taxes 59 Minority Interest 60 Net Income 61 Income Statement 2018 1,200 1,200 1,500 (300) (2,500) (700) (150) (250) (3,600) (3,900) 1 1 (3,900) 1 (3,900) 1 (3,900) 2019 1,500 1,500 1,500 (2,500) (700) (190) (3,390) (3,390) (3,390) (3,390) (3,390) 2020 2,150 2,150 1,750 400 (1,500) (500) H (2,000) (1,600) (1,600) (1,600) (1,600) 150% 150% 123% 136% 117% 94% 109% 115% 39% 170% 0% 142% 120 % 0% 114% 0% 110%
Step by Step Solution
★★★★★
3.38 Rating (160 Votes )
There are 3 Steps involved in it
Step: 1

Get Instant Access to Expert-Tailored Solutions
See step-by-step solutions with expert insights and AI powered tools for academic success
Step: 2

Step: 3

Ace Your Homework with AI
Get the answers you need in no time with our AI-driven, step-by-step assistance
Get Started


