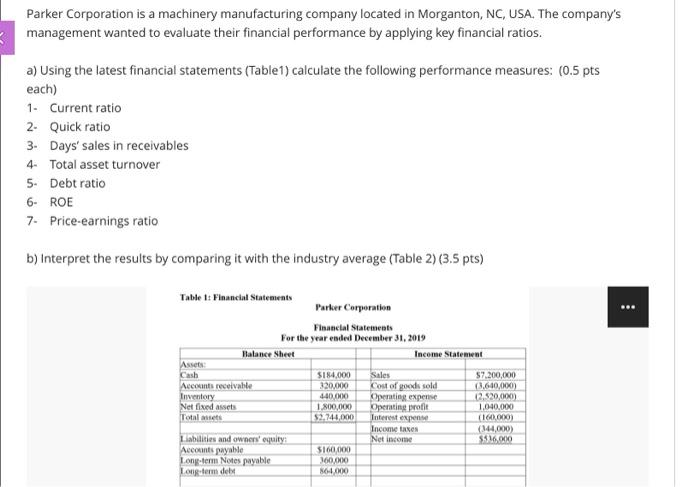
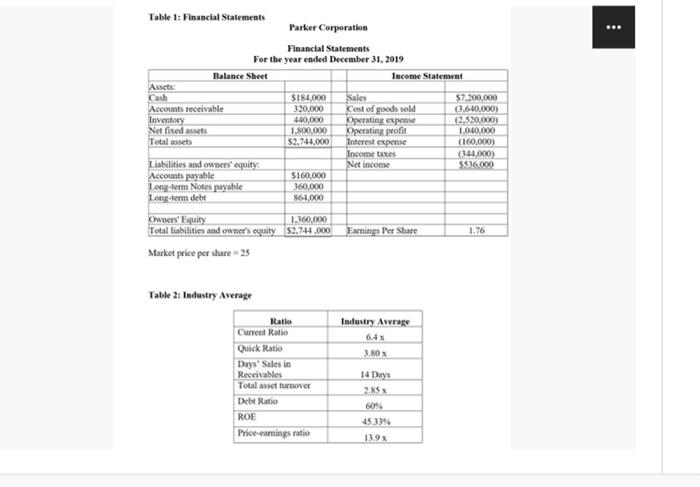
Parker Corporation is a machinery manufacturing company located in Morganton, NC, USA. The company's management wanted to evaluate their financial performance by applying key financial ratios. a) Using the latest financial statements (Table 1) calculate the following performance measures: (0.5 pts each) 1. Current ratio 2. Quick ratio 3. Days' sales in receivables 4. Total asset turnover 5. Debt ratio 6- ROE 7- Price-earnings ratio b) Interpret the results by comparing it with the industry average (Table 2) (3.5 pts) Table 1: Financial Statements Parker Corporation Financial Statements For the year eaded December 31, 2019 Balance Sheet Income Statement Asses Cash $184,000 Sales $7.200,000 Accounts receivable 320,000 Coul of goods sold (3.640,000 Inventory 440.000 Operating expense (2.520,000 Net fixed assets 1.800,000 Operating profit 1,040,000 52744000 Interest expense (160.000) Income taxes (144,000) Liabilities and owners' equity Net Income $$16.000 Accounts payable $160,000 Long-term Notes payable 160.000 Long term debit 364.000 ... Table 1: Financial Statements Parker Corporation Financial Statements For the year ended December 31, 2019 Balance Sheet Income Statement Assets Cash $184.000 Sales $7.200,000 Accounts receivable 320,000 Cost of goods sold (3.640,000) Inventory 410.000 Operating expense 2.520.000) Net fixed assets 1.800.000 Operating profit 1.000.000 Total assets $2.744.000 Interest expense (160.000) Income taxes (344,000) Liabilities and owners' equity Net income Accounts payable S160,000 Long term Notes payable 360,000 Long-term debt 864.000 Farnings Per Share 1.76 Owners' Equity 1.360.000 Total liabilities and owner's equity $2.744.000 Market price per share 25 Table 2: Industry Average Industry Average 64 Ratio Current Ratio Quick Ratio Days Sales in Receivables Total asset turnover Debt Ratio ROE Price-eamings ratio 14 Days 2.85 4533 13.9%