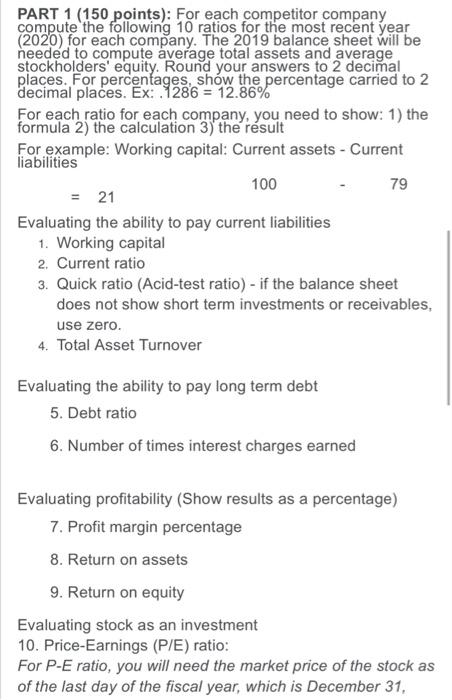
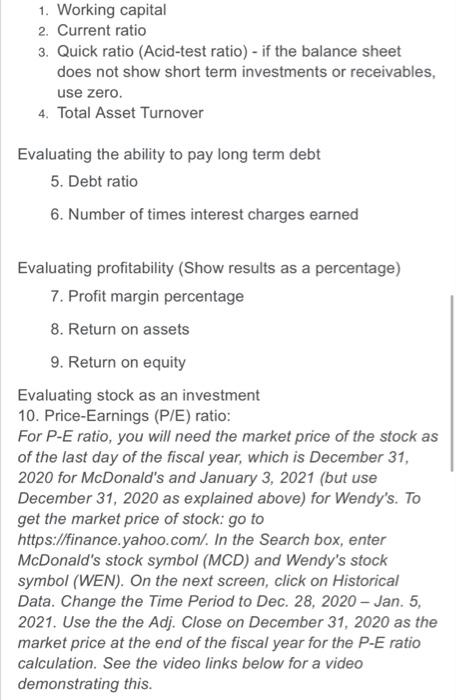
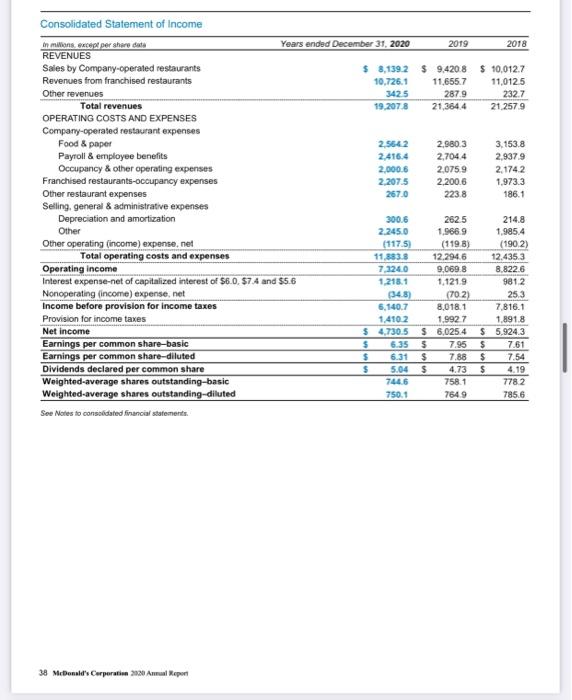
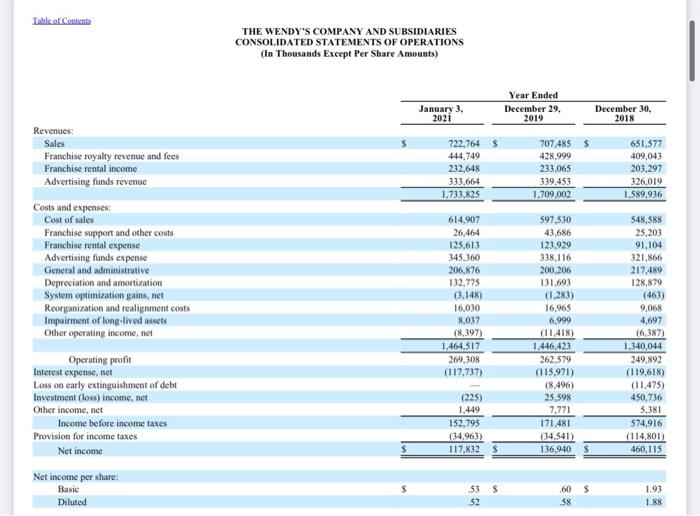
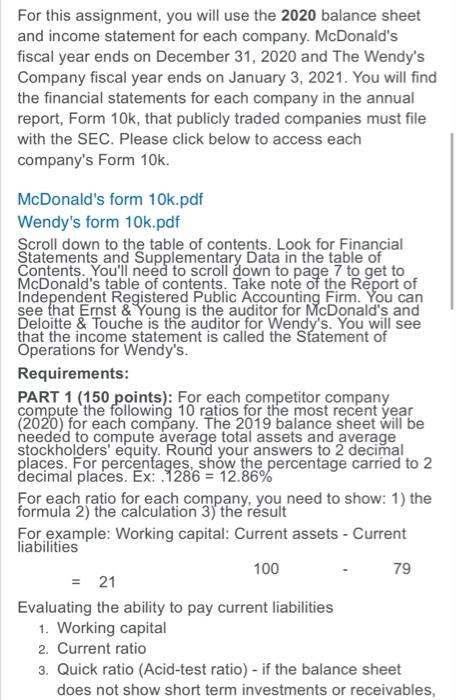
PART 1 (150 points): For each competitor company compute the following 10 ratios for the most recent year (2020) for each company. The 2019 balance sheet will be needed to compute average total assets and average stockholders' equity. Round your answers to 2 decimal places. For percentages, show the percentage carried to 2 decimal places. Ex: 1286 = 12.86% For each ratio for each company, you need to show: 1) the formula 2) the calculation 3) the result For example: Working capital: Current assets - Current liabilities 100 = 21 Evaluating the ability to pay current liabilities 1. Working capital 2. Current ratio 3. Quick ratio (Acid-test ratio) - if the balance sheet does not show short term investments or receivables, use zero. 4. Total Asset Turnover 79 Evaluating the ability to pay long term debt 5. Debt ratio 6. Number of times interest charges earned Evaluating profitability (Show results as a percentage) 7. Profit margin percentage 8. Return on assets 9. Return on equity Evaluating stock as an investment 10. Price-Earnings (P/E) ratio: For P-E ratio, you will need the market price of the stock as of the last day of the fiscal year, which is December 31, 1. Working capital 2. Current ratio 3. Quick ratio (Acid-test ratio) - if the balance sheet does not show short term investments or receivables, use zero. 4. Total Asset Turnover Evaluating the ability to pay long term debt 5. Debt ratio 6. Number of times interest charges earned Evaluating profitability (Show results as a percentage) 7. Profit margin percentage 8. Return on assets 9. Return on equity Evaluating stock as an investment 10. Price-Earnings (P/E) ratio: For P-E ratio, you will need the market price of the stock as of the last day of the fiscal year, which is December 31, 2020 for McDonald's and January 3, 2021 (but use December 31, 2020 as explained above) for Wendy's. To get the market price of stock: go to https://finance.yahoo.com/. In the Search box, enter McDonald's stock symbol (MCD) and Wendy's stock symbol (WEN). On the next screen, click on Historical Data. Change the Time Period to Dec. 28, 2020 - Jan. 5, 2021. Use the the Adj. Close on December 31, 2020 as the market price at the end of the fiscal year for the P-E ratio calculation. See the video links below for a video demonstrating this. 2019 2018 $ 9.420.8 $ 10,012.7 11.6557 11,0125 287.9 232.7 21,364.4 21.2579 2,980.3 2.7044 2.075.9 2.2006 223.8 3,153.8 2,9379 2,1742 1,973.3 186.1 Consolidated Statement of Income in milions excepper share date Years ended December 31, 2020 REVENUES Sales by Company-operated restaurants $ 8,1392 Revenues from franchised restaurants 10,726.1 Other revenues 3425 Total revenues 19,2078 OPERATING COSTS AND EXPENSES Company-operated restaurant expenses Food & paper 2.5642 Payroll & employee benefits 2,416.4 Occupancy & other operating expenses 2.000 6 Franchised restaurants-occupancy expenses 2,207.5 Other restaurant expenses 267.0 Selling, general & administrative expenses Depreciation and amortization 300.6 Other 2.245.0 Other operating (income) expense, net (1175) Total operating costs and expenses 11.883.8 Operating income 7.3240 Interest expense-net of capitalized interest of $6.0 $7.4 and $5.6 1.218.1 Nonoperating income) expense.net (348) Income before provision for income taxes 6.140.7 Provision for income taxes 1.4102 Net income $ 4,7305 Earnings per common share-basic $ 6.35 Earnings per common share-diluted $ 6.31 Dividends declared per common share $ 5.04 Weighted-average shares outstanding-basic 744.6 Weighted average shares outstanding-diluted 750.1 See Notes to consolidated Anancial statements 2625 1.966.9 (1198) 12.2946 9,069,8 1.1219 (702) 8.0181 1.9927 $6,025.4 3 7.95 $ 7.88 $ 4.73 7581 7649 214.8 1.985.4 (1902) 12.435.3 8.822.6 9812 25.3 7.816.1 1.891.8 $ 5,924.3 $ 7.61 $ 7.54 $ 4.19 7782 785.6 38 McDonald's Corporation 2020 A Report Table of Content THE WENDY'S COMPANY AND SUBSIDIARIES CONSOLIDATED STATEMENTS OF OPERATIONS (In Thousands Except Per Share Amounts) January 3. 2021 Year Ended December 29, 2019 December 30, 2018 722,764 $ 444.749 232,648 333,664 1.733.825 707,485$ 428.999 233,065 339.453 1,709002 651.577 409,043 203.297 326,019 1.589,936 Revenues Sales Franchise royalty revenue and fees Franchise rental income Advertising funds revenue Costs and expenses Cost of sales Franchise support and other costs Franchise rental expense Advertising funds expense General and administrative Depreciation and amortization System optimization gains, net Reorganization and realignment costs Impairment of long-lived assets Other operating income.net 614,907 26,464 125,613 345,360 206,876 132,775 (3.148) 16.030 8,037 (8,397) 1,464,517 269,308 (117.737) 597.530 43.686 123.929 338.116 200,206 131.693 (1.283) 16,965 6,999 (11,418) 1.446,423 262,579 (115.971) 548,588 25,203 91,104 321,866 217,489 128.879 (463) 9,068 4,697 (6,387) 1,340,044 249.892 (119,618) (11.475) 450,736 5,381 574,916 (114,801) 460,115 Operating profit Interest expense, net Loss on carly extinguishment of debt Investment (loss) income, net Other income, net Income before income taxes Provision for income taxes Net income (225) 1.449 152.795 (34.963) 117,832 25,598 7.771 171.481 (34.541) 136,9-40 Net income per share: Basic Diluted S .53s 52 .60 58 1.93 1.88 For this assignment, you will use the 2020 balance sheet and income statement for each company. McDonald's fiscal year ends on December 31, 2020 and The Wendy's Company fiscal year ends on January 3, 2021. You will find the financial statements for each company in the annual report, Form 10k, that publicly traded companies must file with the SEC. Please click below to access each company's Form 10k. McDonald's form 10k.pdf Wendy's form 10k.pdf Scroll down to the table of contents. Look for Financial Statements and Supplementary Data in the table of Contents. You'll need to scroll down to page 7 to get to McDonald's table of contents. Take note of the Report of Independent Registered Public Accounting Firm. You can see that Ernst & Young is the auditor for McDonald's and Deloitte & Touche is the auditor for Wendy's. You will see that the income statement is called the Statement of Operations for Wendy's. Requirements: PART 1 (150 points): For each competitor company compute the following 10 ratios for the most recent year (2020) for each company. The 2019 balance sheet will be needed to compute average total assets and average stockholders' equity. Round your answers to 2 decimal places. For percentages, show the percentage carried to 2 decimal places. Ex: 1286 = 12.86% For each ratio for each company, you need to show: 1) the formula 2) the calculation 3) the result For example: Working capital: Current assets - Current liabilities 100 79 = 21 Evaluating the ability to pay current liabilities 1. Working capital 2. Current ratio 3. Quick ratio (Acid-test ratio) - if the balance sheet does not show short term investments or receivables, PART 1 (150 points): For each competitor company compute the following 10 ratios for the most recent year (2020) for each company. The 2019 balance sheet will be needed to compute average total assets and average stockholders' equity. Round your answers to 2 decimal places. For percentages, show the percentage carried to 2 decimal places. Ex: 1286 = 12.86% For each ratio for each company, you need to show: 1) the formula 2) the calculation 3) the result For example: Working capital: Current assets - Current liabilities 100 = 21 Evaluating the ability to pay current liabilities 1. Working capital 2. Current ratio 3. Quick ratio (Acid-test ratio) - if the balance sheet does not show short term investments or receivables, use zero. 4. Total Asset Turnover 79 Evaluating the ability to pay long term debt 5. Debt ratio 6. Number of times interest charges earned Evaluating profitability (Show results as a percentage) 7. Profit margin percentage 8. Return on assets 9. Return on equity Evaluating stock as an investment 10. Price-Earnings (P/E) ratio: For P-E ratio, you will need the market price of the stock as of the last day of the fiscal year, which is December 31, 1. Working capital 2. Current ratio 3. Quick ratio (Acid-test ratio) - if the balance sheet does not show short term investments or receivables, use zero. 4. Total Asset Turnover Evaluating the ability to pay long term debt 5. Debt ratio 6. Number of times interest charges earned Evaluating profitability (Show results as a percentage) 7. Profit margin percentage 8. Return on assets 9. Return on equity Evaluating stock as an investment 10. Price-Earnings (P/E) ratio: For P-E ratio, you will need the market price of the stock as of the last day of the fiscal year, which is December 31, 2020 for McDonald's and January 3, 2021 (but use December 31, 2020 as explained above) for Wendy's. To get the market price of stock: go to https://finance.yahoo.com/. In the Search box, enter McDonald's stock symbol (MCD) and Wendy's stock symbol (WEN). On the next screen, click on Historical Data. Change the Time Period to Dec. 28, 2020 - Jan. 5, 2021. Use the the Adj. Close on December 31, 2020 as the market price at the end of the fiscal year for the P-E ratio calculation. See the video links below for a video demonstrating this. 2019 2018 $ 9.420.8 $ 10,012.7 11.6557 11,0125 287.9 232.7 21,364.4 21.2579 2,980.3 2.7044 2.075.9 2.2006 223.8 3,153.8 2,9379 2,1742 1,973.3 186.1 Consolidated Statement of Income in milions excepper share date Years ended December 31, 2020 REVENUES Sales by Company-operated restaurants $ 8,1392 Revenues from franchised restaurants 10,726.1 Other revenues 3425 Total revenues 19,2078 OPERATING COSTS AND EXPENSES Company-operated restaurant expenses Food & paper 2.5642 Payroll & employee benefits 2,416.4 Occupancy & other operating expenses 2.000 6 Franchised restaurants-occupancy expenses 2,207.5 Other restaurant expenses 267.0 Selling, general & administrative expenses Depreciation and amortization 300.6 Other 2.245.0 Other operating (income) expense, net (1175) Total operating costs and expenses 11.883.8 Operating income 7.3240 Interest expense-net of capitalized interest of $6.0 $7.4 and $5.6 1.218.1 Nonoperating income) expense.net (348) Income before provision for income taxes 6.140.7 Provision for income taxes 1.4102 Net income $ 4,7305 Earnings per common share-basic $ 6.35 Earnings per common share-diluted $ 6.31 Dividends declared per common share $ 5.04 Weighted-average shares outstanding-basic 744.6 Weighted average shares outstanding-diluted 750.1 See Notes to consolidated Anancial statements 2625 1.966.9 (1198) 12.2946 9,069,8 1.1219 (702) 8.0181 1.9927 $6,025.4 3 7.95 $ 7.88 $ 4.73 7581 7649 214.8 1.985.4 (1902) 12.435.3 8.822.6 9812 25.3 7.816.1 1.891.8 $ 5,924.3 $ 7.61 $ 7.54 $ 4.19 7782 785.6 38 McDonald's Corporation 2020 A Report Table of Content THE WENDY'S COMPANY AND SUBSIDIARIES CONSOLIDATED STATEMENTS OF OPERATIONS (In Thousands Except Per Share Amounts) January 3. 2021 Year Ended December 29, 2019 December 30, 2018 722,764 $ 444.749 232,648 333,664 1.733.825 707,485$ 428.999 233,065 339.453 1,709002 651.577 409,043 203.297 326,019 1.589,936 Revenues Sales Franchise royalty revenue and fees Franchise rental income Advertising funds revenue Costs and expenses Cost of sales Franchise support and other costs Franchise rental expense Advertising funds expense General and administrative Depreciation and amortization System optimization gains, net Reorganization and realignment costs Impairment of long-lived assets Other operating income.net 614,907 26,464 125,613 345,360 206,876 132,775 (3.148) 16.030 8,037 (8,397) 1,464,517 269,308 (117.737) 597.530 43.686 123.929 338.116 200,206 131.693 (1.283) 16,965 6,999 (11,418) 1.446,423 262,579 (115.971) 548,588 25,203 91,104 321,866 217,489 128.879 (463) 9,068 4,697 (6,387) 1,340,044 249.892 (119,618) (11.475) 450,736 5,381 574,916 (114,801) 460,115 Operating profit Interest expense, net Loss on carly extinguishment of debt Investment (loss) income, net Other income, net Income before income taxes Provision for income taxes Net income (225) 1.449 152.795 (34.963) 117,832 25,598 7.771 171.481 (34.541) 136,9-40 Net income per share: Basic Diluted S .53s 52 .60 58 1.93 1.88 For this assignment, you will use the 2020 balance sheet and income statement for each company. McDonald's fiscal year ends on December 31, 2020 and The Wendy's Company fiscal year ends on January 3, 2021. You will find the financial statements for each company in the annual report, Form 10k, that publicly traded companies must file with the SEC. Please click below to access each company's Form 10k. McDonald's form 10k.pdf Wendy's form 10k.pdf Scroll down to the table of contents. Look for Financial Statements and Supplementary Data in the table of Contents. You'll need to scroll down to page 7 to get to McDonald's table of contents. Take note of the Report of Independent Registered Public Accounting Firm. You can see that Ernst & Young is the auditor for McDonald's and Deloitte & Touche is the auditor for Wendy's. You will see that the income statement is called the Statement of Operations for Wendy's. Requirements: PART 1 (150 points): For each competitor company compute the following 10 ratios for the most recent year (2020) for each company. The 2019 balance sheet will be needed to compute average total assets and average stockholders' equity. Round your answers to 2 decimal places. For percentages, show the percentage carried to 2 decimal places. Ex: 1286 = 12.86% For each ratio for each company, you need to show: 1) the formula 2) the calculation 3) the result For example: Working capital: Current assets - Current liabilities 100 79 = 21 Evaluating the ability to pay current liabilities 1. Working capital 2. Current ratio 3. Quick ratio (Acid-test ratio) - if the balance sheet does not show short term investments or receivables