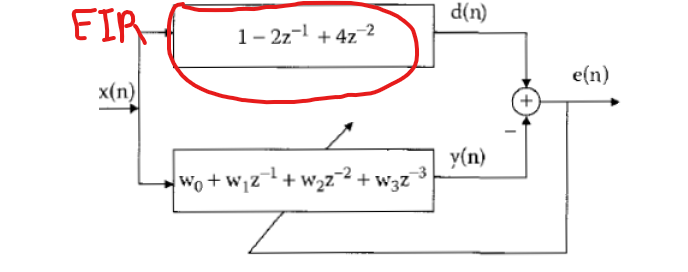
Question
Part 1 A) Generate and plot the input x[n] x[n]= cos(0.03n) for N=2000 samples. B) Plot the amplitude and phase response for the given FIR

Part 1 A) Generate and plot the input x[n] x[n]= cos(0.03n) for N=2000 samples.
B) Plot the amplitude and phase response for the given FIR system. C) Plot the spectrum for the input signal x[n]. D) Implement the LMS algorithm to estimate the filter coefficients w0,. w3 is assumed to be very small (try =0.01). Plot the learning curves: 1. The error e(n). 2. (J vs iteration steps). Where J is defined to be J=e2(n). 3. (10log10(J) vs iteration steps). E) Plot the amplitude and phase response for the estimated FIR system at the end of the iterations. Compare it with the given FIR system. F) Decrease the value of . What is the effect of changing on the speed of the learning process and on the steady state error? G) Add 40dB of zeros mean white Gaussian noise to x[n] (hint: use awgn() mathlab function). Repeat parts (D)-(F). Give your conclusions. H) Repeat part (G) for 30dB. Try to modify the step size value. I) Ensemble averaging: Repeat part (G) for 1000 trials and average the obtained J over the number of trials. plot the averaged J (10log10(J) vs iteration steps)
Code Matlab
Step by Step Solution
There are 3 Steps involved in it
Step: 1

Get Instant Access to Expert-Tailored Solutions
See step-by-step solutions with expert insights and AI powered tools for academic success
Step: 2

Step: 3

Ace Your Homework with AI
Get the answers you need in no time with our AI-driven, step-by-step assistance
Get Started


