Answered step by step
Verified Expert Solution
Link Copied!

Question

1 Approved Answer

Part 1: A random sample of cross-section, observational data was collected. The vari- ables X; and Y are measured in units. Consider the following sample
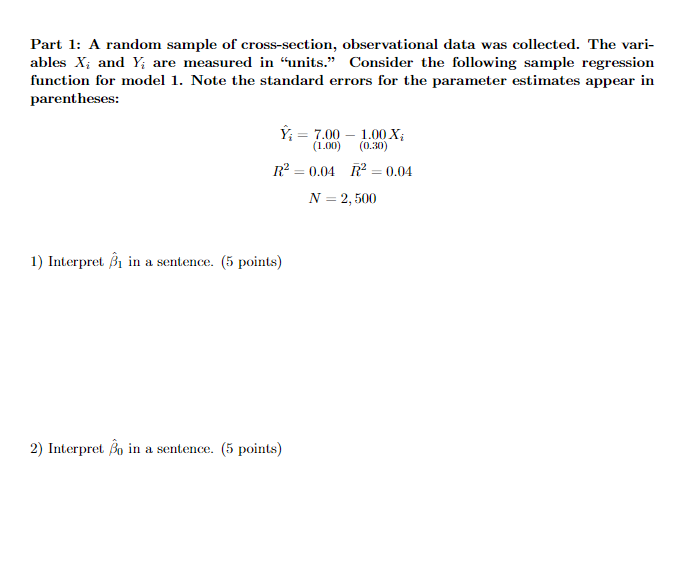
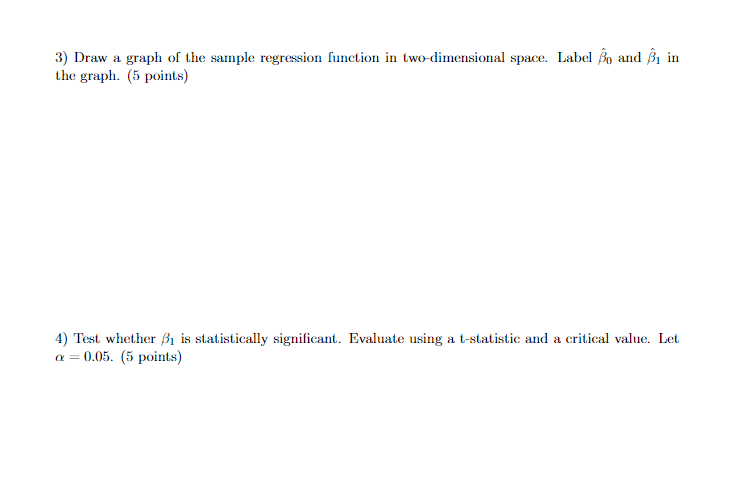
image text in transcribedimage text in transcribed
Part 1: A random sample of cross-section, observational data was collected. The vari- ables X; and Y are measured in "units." Consider the following sample regression function for model 1. Note the standard errors for the parameter estimates appear in parentheses: YA = 7.00 - 1.00X; (1.00) (0.30) R2 =0.04 R= = 0.04 N = 2, 500 1) Interpret B in a sentence. (5 points) 2) Interpret So in a sentence. (5 points)3) Draw a graph of the sample regression function in two-dimensional space. Label Bo and B, in the graph. (5 points) 4) Test whether B is statistically significant. Evaluate using a t-statistic and a critical value. Let ( =0.05. (5 points)

Step by Step Solution

There are 3 Steps involved in it

Step: 1

blur-text-image

Get Instant Access to Expert-Tailored Solutions

See step-by-step solutions with expert insights and AI powered tools for academic success

Step: 2

blur-text-image

Step: 3

blur-text-image

Ace Your Homework with AI

Get the answers you need in no time with our AI-driven, step-by-step assistance

Get Started

Recommended Textbook for

Linear Algebra

Authors: Jim Hefferon

1st Edition

978-0982406212, 0982406215

More Books

Students also viewed these Mathematics questions

Question

How does an IOS help companies improve funds flow?

Answered: 1 week ago