Part 1: Connect with the reading (8 pts) Most relevant readings include: * https://www.teachastronomy.com/textbook/Detecting-Radiation-from- Space/Thermal-Spectra/ * https://openstax.org/books/astronomy/pages/5-2-the-electromagnetic-spectrum especially the part on Radiation and Temperature and
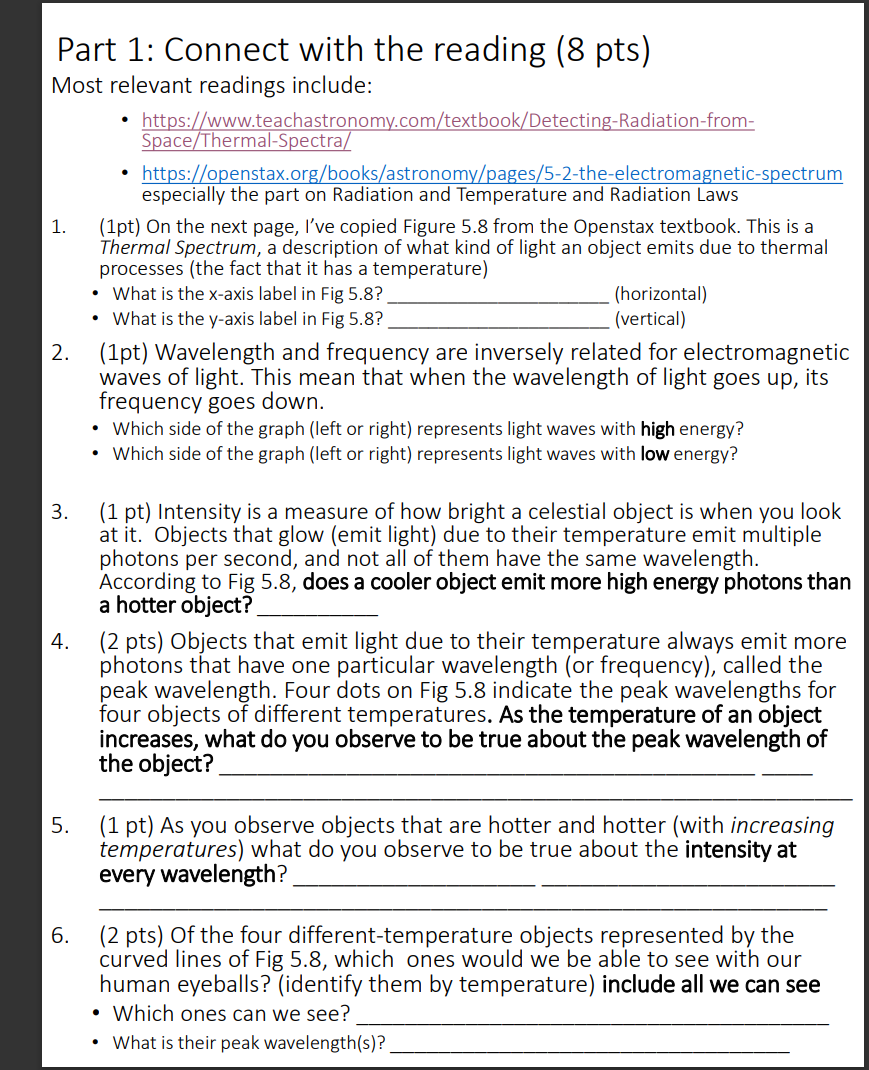
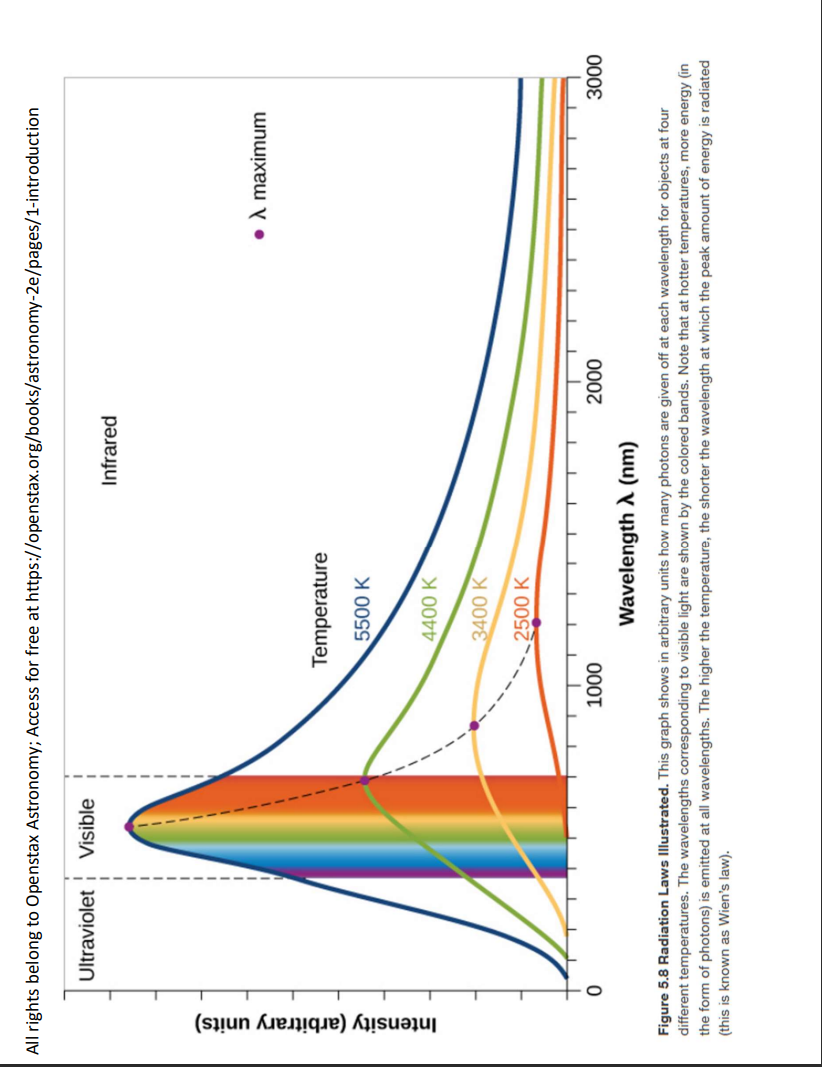
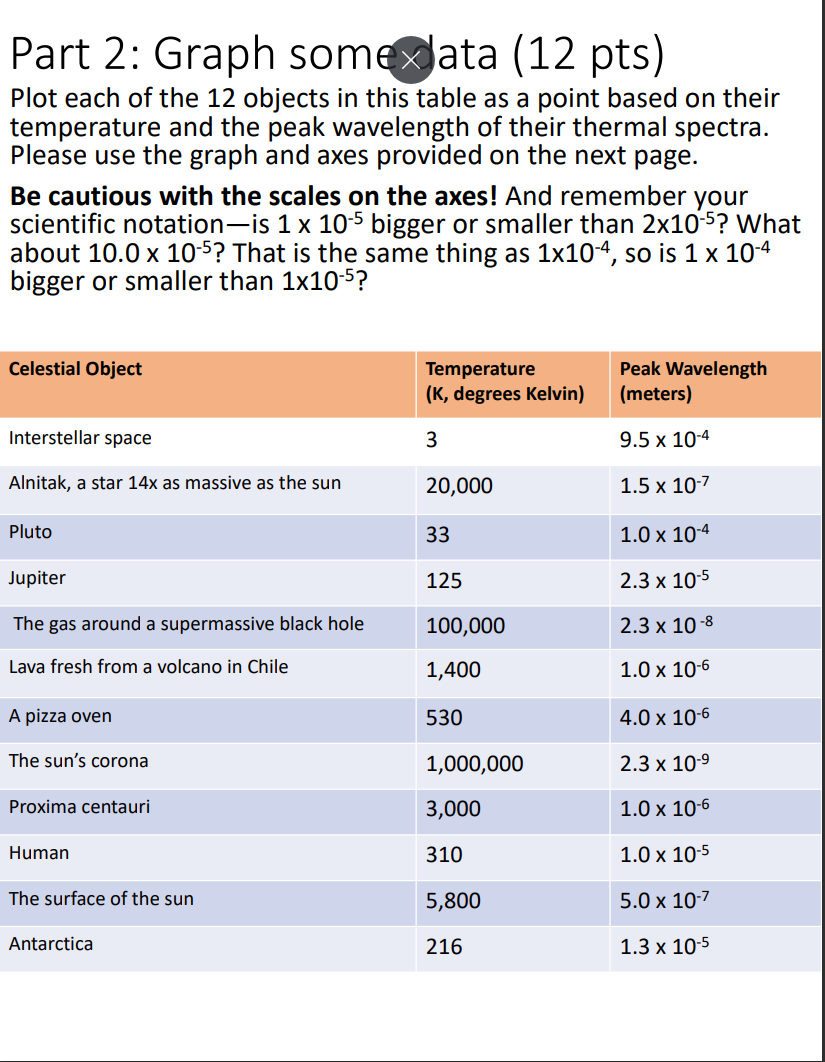
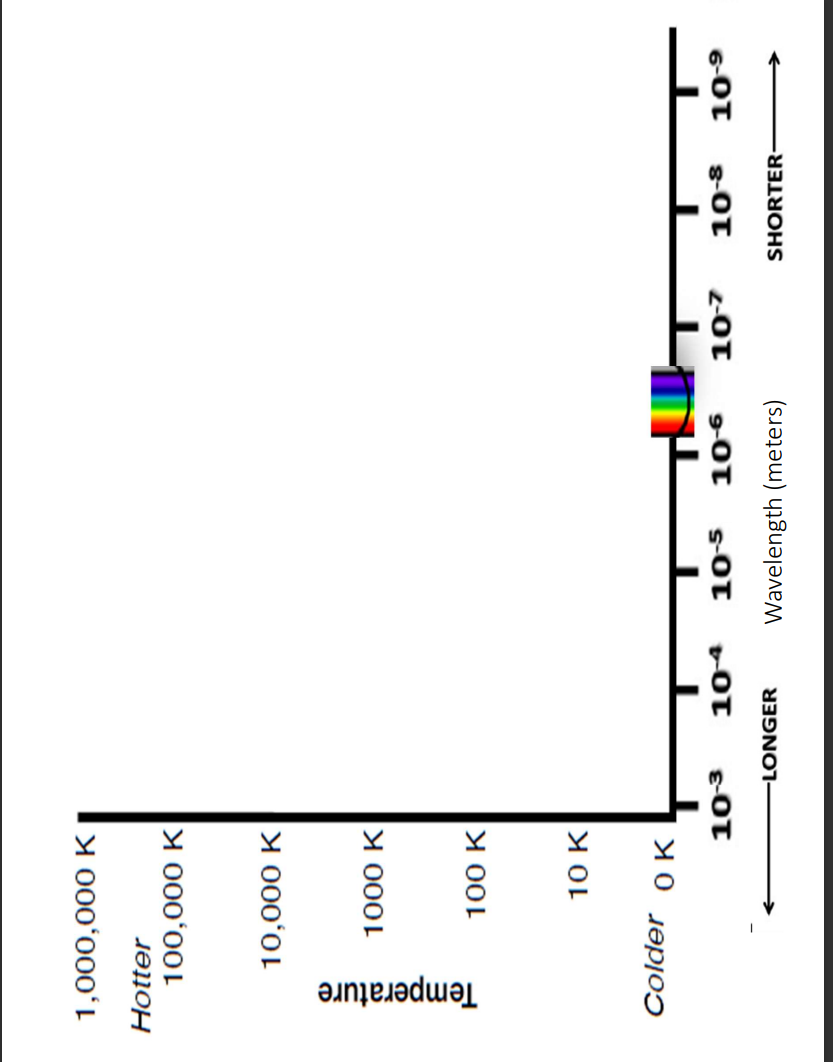
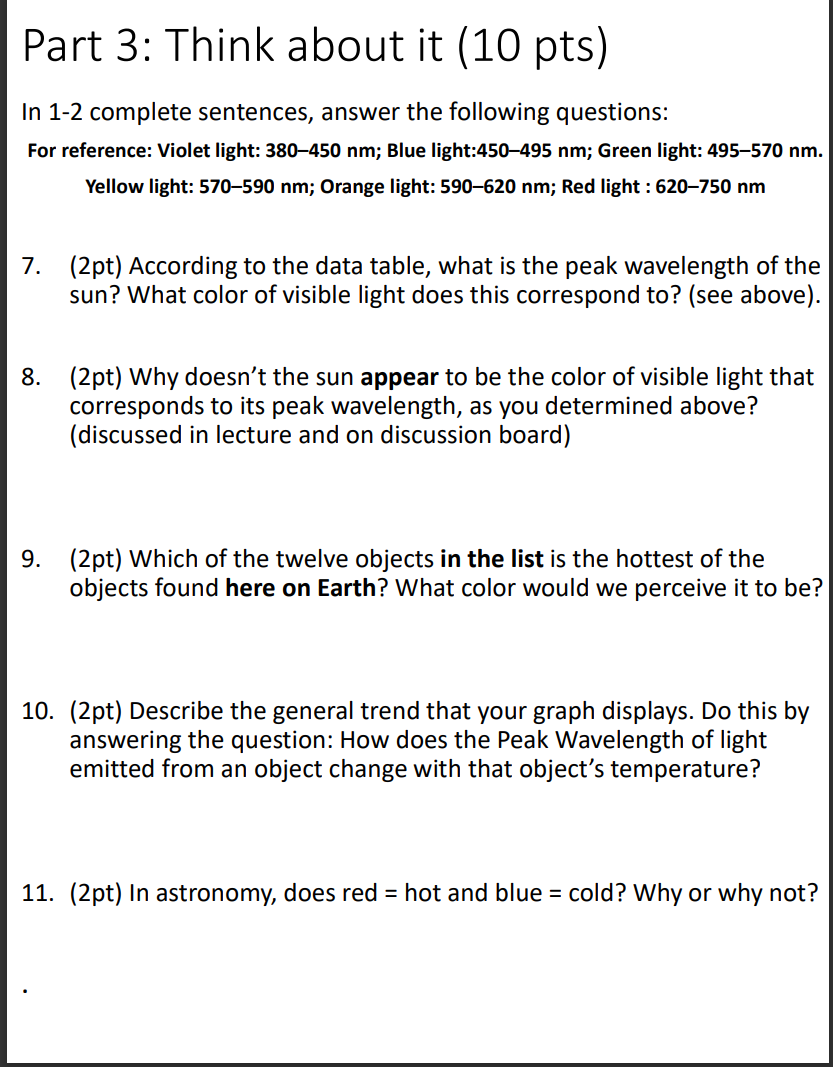
Part 1: Connect with the reading (8 pts) Most relevant readings include: * https://www.teachastronomy.com/textbook/Detecting-Radiation-from- Space/Thermal-Spectra/ * https://openstax.org/books/astronomy/pages/5-2-the-electromagnetic-spectrum especially the part on Radiation and Temperature and Radiation Laws (1pt) On the next page, |'ve copied Figure 5.8 from the Openstax textbook. This is a Thermal Spectrum, a description of what kind of light an object emits due to thermal processes (the fact that it has a temperature) * What is the x-axis label in Fig 5.87 _ PR * What is the y-axis label in Fig 5.87 (horizontal) (vertical) (1pt) Wavelength and frequency are inversely related for electromagnetic waves of light. This mean that when the wavelength of light goes up, its frequency goes down. * Which side of the graph (left or right) represents light waves with high energy? * Which side of the graph (left or right) represents light waves with low energy? (1 pt) Intensity is a measure of how bright a celestial object is when you look at it. Objects that glow (emit light) due to their temperature emit multiple photons per second, and not all of them have the same wavelength. According to Fig 5.8, does a cooler object emit more high energy photons than a hotter object? (2 pts) Objects that emit light due to their temperature always emit more photons that have one particular wavelength (or frequency), called the peak wavelength. Four dots on Fig 5.8 indicate the peak wavelengths for four objects of different temperatures. As the temperature of an object increases, what do you observe to be true about the peak wavelength of the object? (1 pt) As you observe objects that are hotter and hotter (with increasing temperatures) what do you observe to be true about the intensity at every wavelength? (2 pts) Of the four different-temperature objects represented by the curved lines of Fig 5.8, which ones would we be able to see with our human eyeballs? (identify them by temperature) include all we can see * Which ones can we see? * What is their peak wavelength(s)? All rights belong to Openstax Astronomy; Access for free at https://openstax.org/books/astronomy-2e/pages/1-introduction Ultraviolet | Visible Infrared . A maximum Intensity (arbitrary units) Temperature 5500 K 4400 K 3400 K -2500 K 1000 2000 3000 Wavelength X (nm) Figure 5.8 Radiation Laws Illustrated. This graph shows in arbitrary units how many photons are given off at each wavelength for objects at four different temperatures. The wavelengths corresponding to visible light are shown by the colored bands. Note that at hotter temperatures, more energy (in the form of photons) is emitted at all wavelengths. The higher the temperature, the shorter the wavelength at which the peak amount of energy is radiated (this is known as Wien's law).Part 2: Graph some@ata (12 pts) Plot each of the 12 objects in this table as a point based on their temperature and the peak wavelength of their thermal spectra. Please use the graph and axes provided on the next page. Be cautious with the scales on the axes! And remember your scientific notationis 1 x 10~ bigger or smaller than 2x10? What about 10.0 x 10? That is the same thing as 1x10%, sois 1 x 10 bigger or smaller than 1x10>7? Celestial Object Temperature Peak Wavelength (K, degrees Kelvin) (meters) Interstellar space 3 9.5x 10⁴ Alnitak, a star 14x as massive as the sun 20,000 1.5 x 10/ Pluto 33 1.0x 10* Jupiter 125 23x10 The gas around a supermassive black hole 100,000 2310+ Lava fresh from a volcano in Chile 1,400 1.0 x 10 A pizza oven 530 4.0x10 The sun's corona 1,000,000 2.3x10 Proxima centauri 3,000 1.0x 10 Human 310 1.0x 10> The surface of the sun 5,800 5.0x 10⁷ Antarctica 216 13x10 \fPart 3: Think about it (10 pts) In 1-2 complete sentences, answer the following questions: For reference: Violet light: 380-450 nm; Blue light:450-495 nm; Green light: 495-570 nm. Yellow light: 570-590 nm; Orange light: 590-620 nm; Red light : 620-750 nm 7. (2pt) According to the data table, what is the peak wavelength of the sun? What color of visible light does this correspond to? (see above). 8. (2pt) Why doesn't the sun appear to be the color of visible light that corresponds to its peak wavelength, as you determined above? (discussed in lecture and on discussion board) 9. (2pt) Which of the twelve objects in the list is the hottest of the objects found here on Earth? What color would we perceive it to be? 10. (2pt) Describe the general trend that your graph displays. Do this by answering the question: How does the Peak Wavelength of light emitted from an object change with that object's temperature? 11. (2pt) In astronomy, does red = hot and blue = cold? Why or why not
Step by Step Solution
There are 3 Steps involved in it
Step: 1
Get Instant Access to Expert-Tailored Solutions
See step-by-step solutions with expert insights and AI powered tools for academic success
Step: 2
Step: 3
Ace Your Homework with AI
Get the answers you need in no time with our AI-driven, step-by-step assistance