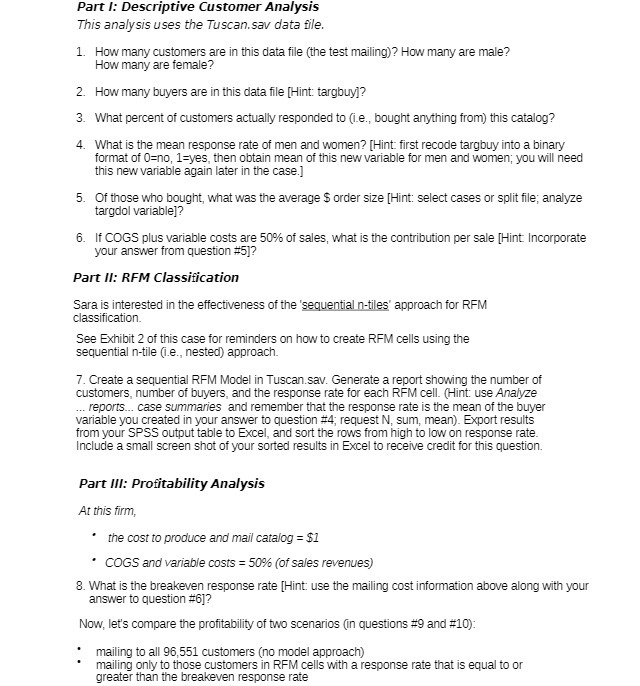
Part 1: Descriptive Customer Analysis This analysis uses the Tuscan. sav data file. 1. How many customers are in this data file (the test mailing)? How many are male? How many are female? 2. How many buyers are in this data file [Hint: targbuy]? 3. What percent of customers actually responded to (ie., bought anything from) this catalog? 4. What is the mean response rate of men and women? [Hint: first recode targbuy into a binary format of 0=no, 1=yes, then obtain mean of this new variable for men and women; you will need this new variable again later in the case.] 5. Of those who bought, what was the average $ order size [Hint: select cases or split file; analyze targdol variable]? 6. If COGS plus variable costs are 50% of sales, what is the contribution per sale [Hint Incorporate your answer from question #5]? Part II: RFM Classification Sara is interested in the effectiveness of the 'sequential n-tiles' approach for RFM classification. See Exhibit 2 of this case for reminders on how to create RFM cells using the sequential n-tile (ie., nested) approach. 7. Create a sequential RFM Model in Tuscan.sav. Generate a report showing the number of customers, number of buyers, and the response rate for each RFM cell. (Hint: use Analyze ... reports... case summaries and remember that the response rate is the mean of the buyer variable you created in your answer to question #4; request N, sum, mean). Export results from your SPSS output table to Excel, and sort the rows from high to low on response rate Include a small screen shot of your sorted results in Excel to receive credit for this question. Part III: Profitability Analysis At this firm, * the cost to produce and mail catalog = $1 COGS and variable costs = 50% (of sales revenues) B. What is the breakeven response rate [Hint: use the mailing cost information above along with your answer to question #6]? Now, let's compare the profitability of two scenarios (in questions #9 and #10): mailing to all 96,551 customers (no model approach) mailing only to those customers in RFM cells with a response rate that is equal to or greater than the breakeven response rate


