part 1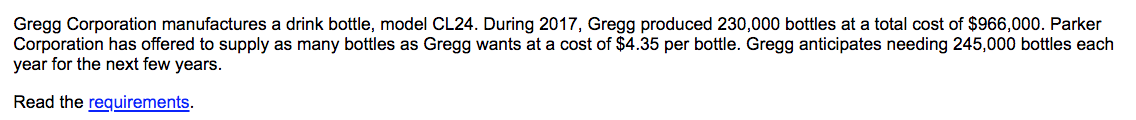

 part 2
 Drop box options for part 2, (1-9)
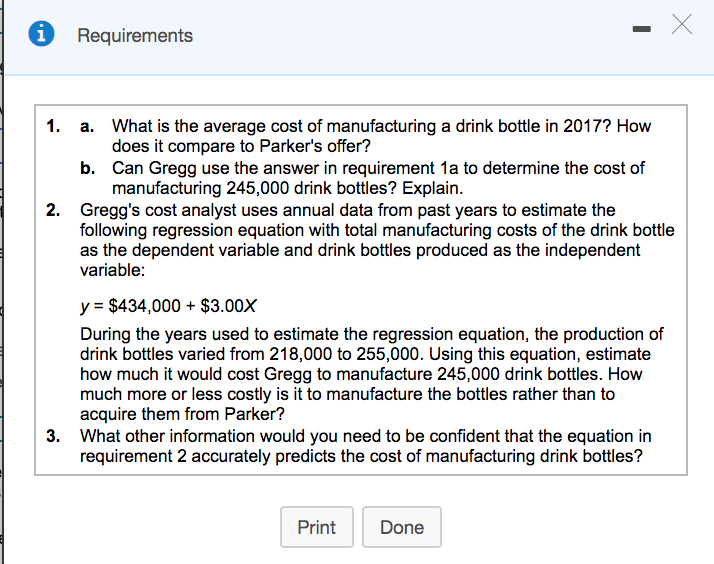
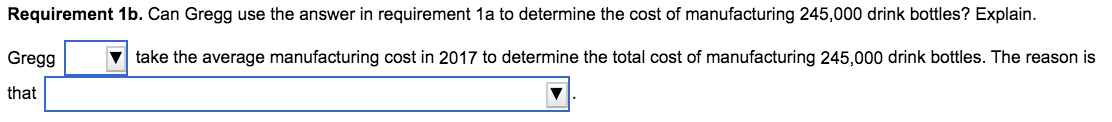
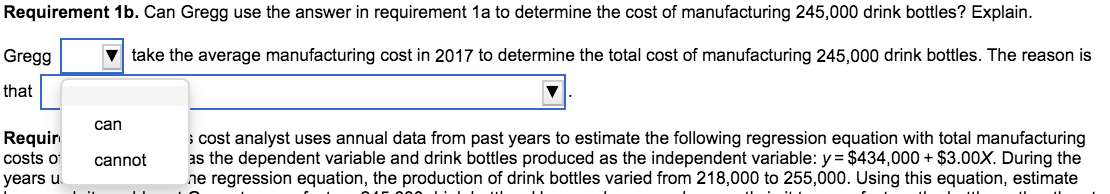
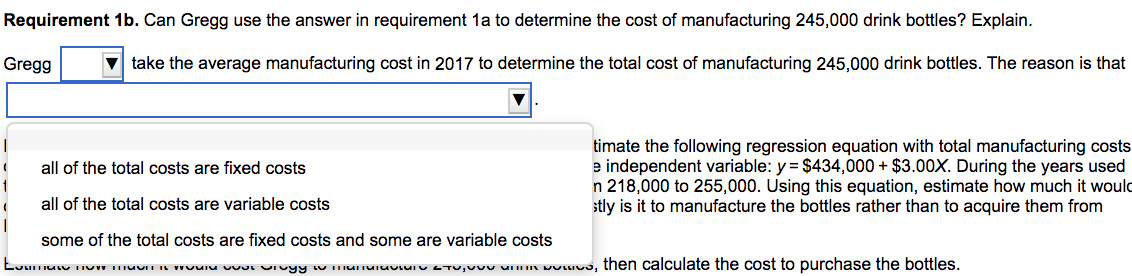
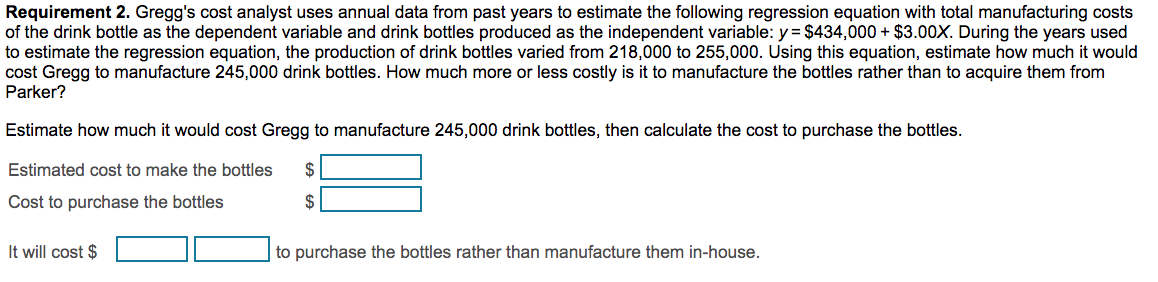
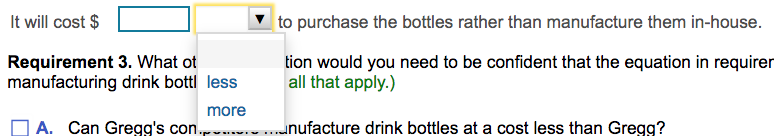
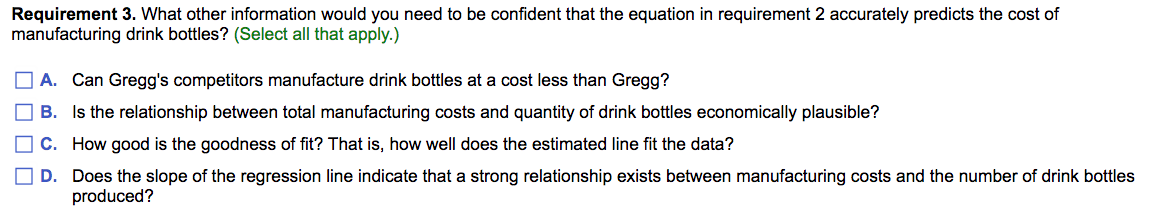
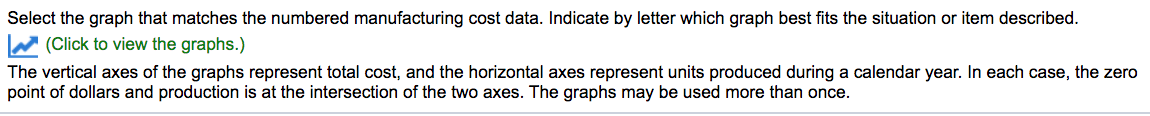
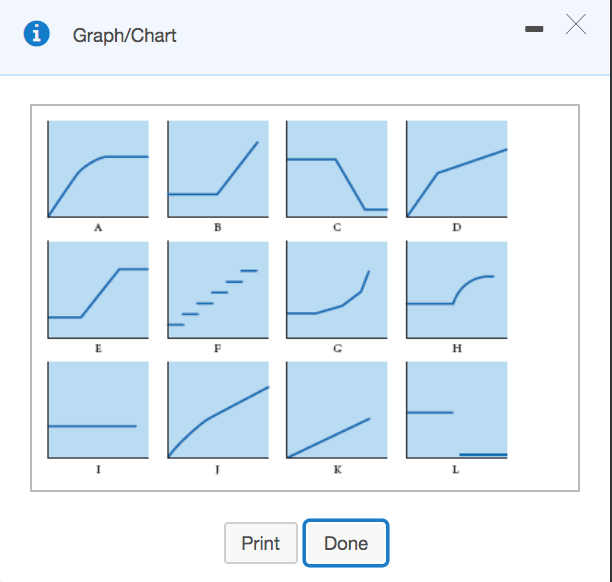
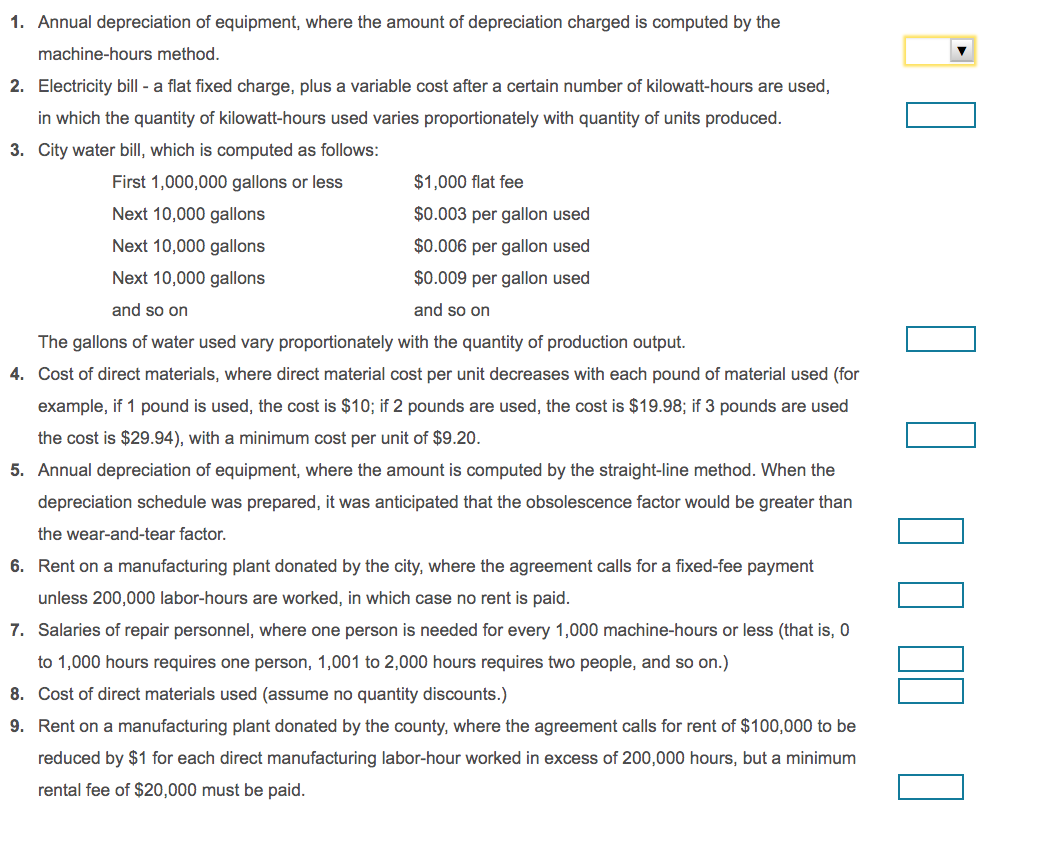
Gregg Corporation manufactures a drink bottle, model CL24. During 2017, Gregg produced 230,000 bottles at a total cost of $966,000. Parker Corporation has offered to supply as many bottles as Gregg wants at a cost of $4.35 per bottle. Gregg anticipates needing 245,000 bottles each year for the next few years. Read the requirements. i X Requirements 1. a. What is the average cost of manufacturing a drink bottle in 2017? How does it compare to Parker's offer? b. Can Gregg use the answer in requirement 1a to determine the cost of manufacturing 245,000 drink bottles? Explain. 2. Gregg's cost analyst uses annual data from past years to estimate the following regression equation with total manufacturing costs of the drink bottle as the dependent variable and drink bottles produced as the independent variable: y = $434,000 + $3.00X During the years used to estimate the regression equation, the production of drink bottles varied from 218,000 to 255,000. Using this equation, estimate how much it would cost Gregg to manufacture 245,000 drink bottles. How much more or less costly is it to manufacture the bottles rather than to acquire them from Parker? 3. What other information would you need to be confident that the equation in requirement 2 accurately predicts the cost of manufacturing drink bottles? Print Done Requirement 1a. What is the average cost of manufacturing a drink bottle in 2017? How does it compare to Parker's offer? The average cost of per bottle is than Parker's offer. Requirement 1b. Can Gregg use the answer in requirement 1a to determine the cost of manufacturing 245,000 drink bottles? Explain. Gregg take the average manufacturing cost in 2017 to determine the total cost of manufacturing 245,000 drink bottles. The reason is that Requirement 1b. Can Gregg use the answer in requirement 1a to determine the cost of manufacturing 245,000 drink bottles? Explain. Gregg v take the average manufacturing cost in 2017 to determine the total cost of manufacturing 245,000 drink bottles. The reason is that can Requir costs o cannot i cost analyst uses annual data from past years to estimate the following regression equation with total manufacturing as the dependent variable and drink bottles produced as the independent variable: y = $434,000+ $3.00X. During the ne regression equation, the production of drink bottles varied from 218,000 to 255,000. Using this equation, estimate years u Requirement 1b. Can Gregg use the answer in requirement 1a to determine the cost of manufacturing 245,000 drink bottles? Explain. Gregg v take the average manufacturing cost in 2017 to determine the total cost of manufacturing 245,000 drink bottles. The reason is that timate the following regression equation with total manufacturing costs all of the total costs are fixed costs e independent variable: y = $434,000 + $3.00x. During the years used 1 n 218,000 to 255,000. Using this equation, estimate how much it would all of the total costs are variable costs stly is it to manufacture the bottles rather than to acquire them from some of the total costs are fixed costs and some are variable costs Lour TULU TUW TUITII PUIU UUU Urvyy w MUHTUIUUSUIU LTU, UVU I wouvo, then calculate the cost to purchase the bottles. Requirement 2. Gregg's cost analyst uses annual data from past years to estimate the following regression equation with total manufacturing costs of the drink bottle as the dependent variable and drink bottles produced as the independent variable: y = $434,000+ $3.00X. During the years used to estimate the regression equation, the production of drink bottles varied from 218,000 to 255,000. Using this equation, estimate how much it would cost Gregg to manufacture 245,000 drink bottles. How much more or less costly is it to manufacture the bottles rather than to acquire them from Parker? Estimate how much it would cost Gregg to manufacture 245,000 drink bottles, then calculate the cost to purchase the bottles. $ Estimated cost to make the bottles Cost to purchase the bottles $ It will cost $ to purchase the bottles rather than manufacture them in-house. It will cost $ to purchase the bottles rather than manufacture them in-house. Requirement 3. What ot manufacturing drink bottl less more A. Can Gregg's con. tion would you need to be confident that the equation in requirer all that apply.) ...nufacture drink bottles at a cost less than Gregg? Requirement 3. What other information would you need to be confident that the equation in requirement 2 accurately predicts the cost of manufacturing drink bottles? (Select all that apply.) A. Can Gregg's competitors manufacture drink bottles at a cost less than Gregg? B. Is the relationship between total manufacturing costs and quantity of drink bottles economically plausible? C. How good is the goodness of fit? That is, how well does the estimated line fit the data? D. Does the slope of the regression line indicate that a strong relationship exists between manufacturing costs and the number of drink bottles produced? Select the graph that matches the numbered manufacturing cost data. Indicate by letter which graph best fits the situation or item described. (Click to view the graphs.) The vertical axes of the graphs represent total cost, and the horizontal axes represent units produced during a calendar year. In each case, the zero point of dollars and production is at the intersection of the two axes. The graphs may be used more than once. i Graph/Chart GE B F H 1 K L Print Done 1. Annual depreciation of equipment, where the amount of depreciation charged is computed by the machine-hours method. 2. Electricity bill - a flat fixed charge, plus a variable cost after a certain number of kilowatt-hours are used, in which the quantity of kilowatt-hours used varies proportionately with quantity of units produced. 3. City water bill, which is computed as follows: First 1,000,000 gallons or less $1,000 flat fee Next 10,000 gallons $0.003 per gallon used Next 10,000 gallons $0.006 per gallon used Next 10,000 gallons $0.009 per gallon used and so on and so on The gallons of water used vary proportionately with the quantity of production output. 4. Cost of direct materials, where direct material cost per unit decreases with each pound of material used (for example, if 1 pound is used, the cost is $10; if 2 pounds are used, the cost is $19.98; if 3 pounds are used the cost is $29.94), with a minimum cost per unit of $9.20. 5. Annual depreciation of equipment, where the amount is computed by the straight-line method. When the depreciation schedule was prepared, it was anticipated that the obsolescence factor would be greater than the wear-and-tear factor. 6. Rent on a manufacturing plant donated by the city, where the agreement calls for a fixed-fee payment unless 200,000 labor-hours are worked, in which case no rent is paid. 7. Salaries of repair personnel, where one person is needed for every 1,000 machine-hours or less (that is, o to 1,000 hours requires one person, 1,001 to 2,000 hours requires two people, and so on.) 8. Cost of direct materials used (assume no quantity discounts.) 9. Rent on a manufacturing plant donated by the county, where the agreement calls for rent of $100,000 to be reduced by $1 for each direct manufacturing labor-hour worked in excess of 200,000 hours, but a minimum rental fee of $20,000 must be paid. B