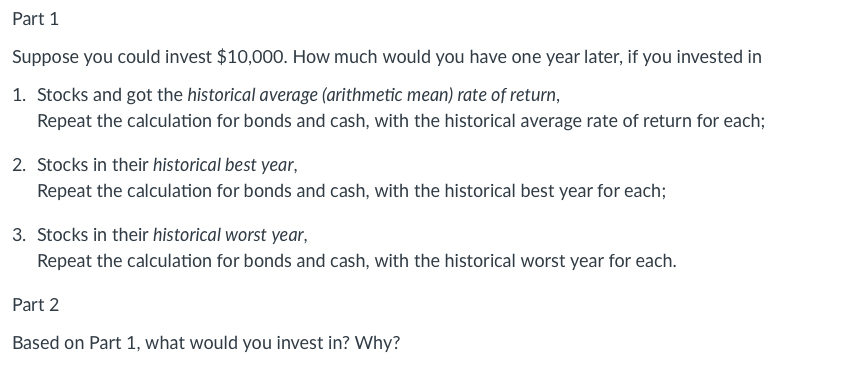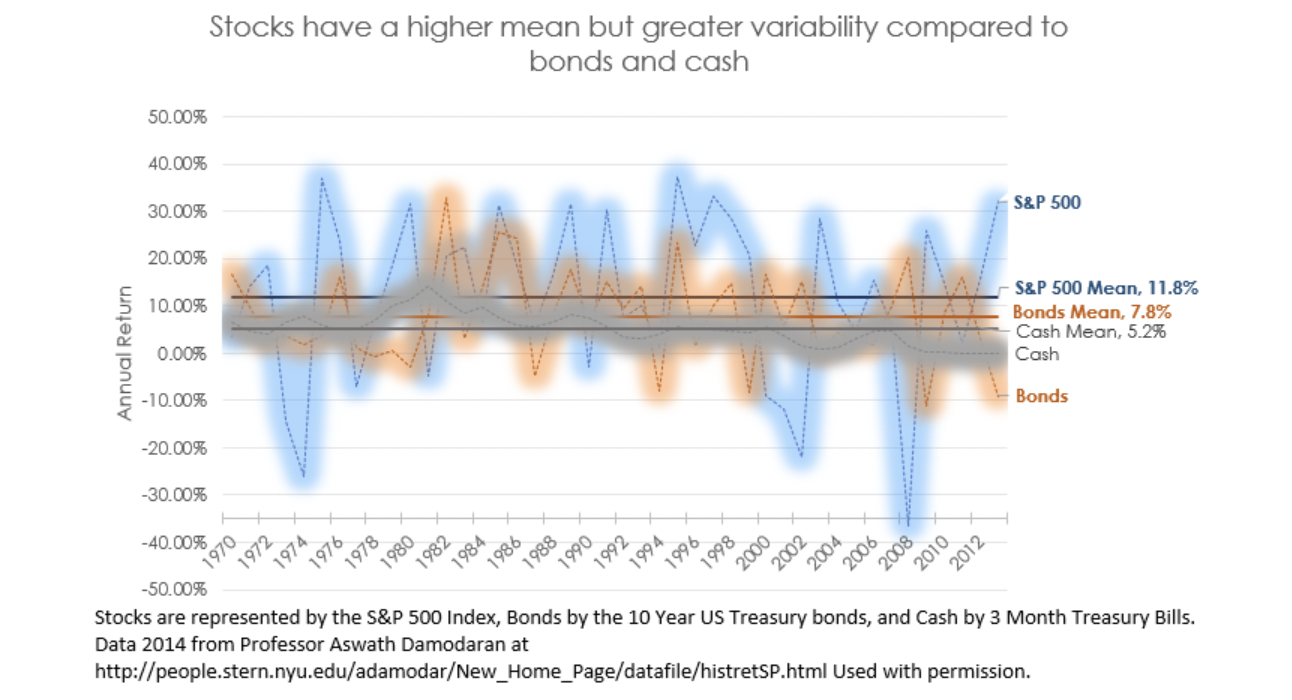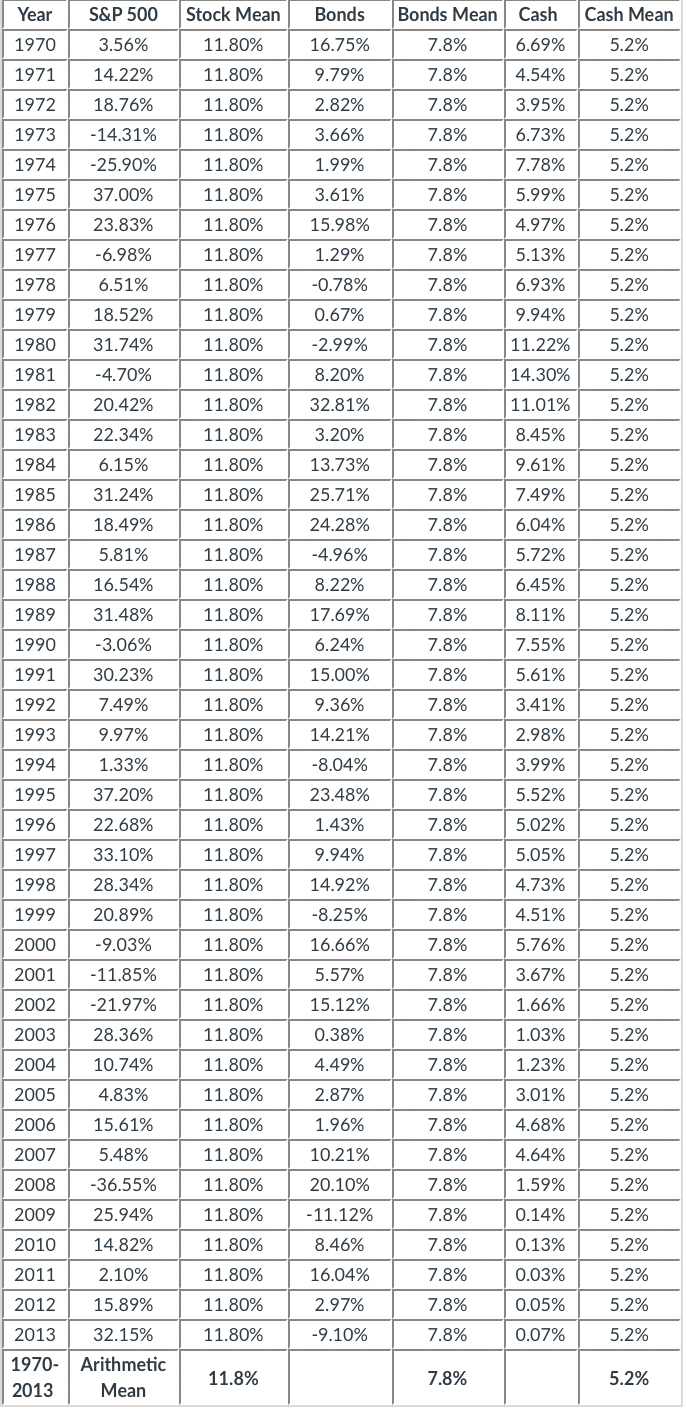


Part 1 Suppose you could invest $10,000. How much would you have one year later, if you invested in 1. Stocks and got the historical average (arithmetic mean) rate of return, Repeat the calculation for bonds and cash, with the historical average rate of return for each; 2. Stocks in their historical best year, Repeat the calculation for bonds and cash, with the historical best year for each; 3. Stocks in their historical worst year, Repeat the calculation for bonds and cash, with the historical worst year for each. Part 2 Based on Part 1, what would you invest in? Why? Stocks have a higher mean but greater variability compared to bonds and cash 50.00% 40.00% S&P 500 30.00% 20.00% 10.00% Annual Return S&P 500 Mean, 11.8% Bonds Mean, 7.8% Cash Mean, 5.2% Cash 0.00% -10.00% Bonds -20.00% -30.00% -40.00% 1976 1992 1990 2004 1974 1994 1970 1972 1998 2000 2002 -50.00% Stocks are represented by the S&P 500 Index, Bonds by the 10 Year US Treasury bonds, and Cash by 3 Month Treasury Bills. Data 2014 from Professor Aswath Damodaran at http://people.stern.nyu.edu/adamodar/New_Home_Page/datafile/histretSP.html Used with permission. 1978 1980 1982 1984 1986 1988 2006 2008 2010 2012 Year S&P 500 Stock Mean Bonds Bonds Mean Cash Cash Mean 1970 3.56% 11.80% 16.75% 6.69% 5.2% 7.8% 7.8% 1971 9.79% 4.54% 5.2% 14.22% 18.76% 11.80% 11.80% 1972 2.82% 3.95% 7.8% 7.8% 5.2% 5.2% 1973 -14.31% 11.80% 3.66% 6.73% 1974 -25.90% 11.80% 1.99% 7.8% 7.78% 5.2% 1975 37.00% 11.80% 3.61% 7.8% 5.99% 5.2% 1976 23.83% 11.80% 15.98% 7.8% 4.97% 5.13% 5.2% 5.2% 1977 -6.98% 11.80% 7.8% 1.29% -0.78% 1978 6.51% 11.80% 7.8% 6.93% 5.2% 1979 7.8% 9.94% 5.2% 18.52% 31.74% 11.80% 11.80% 0.67% -2.99% 1980 11.22% 7.8% 7.8% 5.2% 5.2% 1981 -4.70% 11.80% 8.20% 14.30% 1982 20.42% 11.80% 32.81% 7.8% 5.2% 11.01% 8.45% 1983 22.34% 11.80% 3.20% 7.8% 5.2% 1984 6.15% 11.80% 7.8% 9.61% 5.2% 1985 31.24% 11.80% 7.8% 7.49% 5.2% 13.73% 25.71% 24.28% -4.96% 1986 18.49% 11.80% 6.04% 7.8% 7.8% 5.2% 5.2% 1987 5.81% 11.80% 5.72% 1988 16.54% 11.80% 8.22% 7.8% 6.45% 5.2% 1989 31.48% 11.80% 17.69% 7.8% 5.2% 8.11% 7.55% 1990 -3.06% 11.80% 6.24% 7.8% 5.2% 1991 30.23% 11.80% 15.00% 7.8% 5.61% 5.2% 1992 11.80% 9.36% 7.8% 3.41% 5.2% 1993 7.49% 9.97% 1.33% 11.80% 7.8% 2.98% 5.2% 14.21% -8.04% 1994 11.80% 3.99% 7.8% 7.8% 5.2% 5.2% 1995 37.20% 11.80% 23.48% 5.52% 1996 22.68% 11.80% 7.8% 5.02% 5.2% 1.43% 9.94% 1997 33.10% 11.80% 7.8% 5.05% 5.2% 1998 28.34% 11.80% 14.92% 7.8% 4.73% 5.2% 1999 20.89% -8.25% 7.8% 4.51% 5.2% 11.80% 11.80% 2000 -9.03% 16.66% 7.8% 5.76% 5.2% 2001 -11.85% 11.80% 7.8% 3.67% 5.2% 5.57% 15.12% 2002 -21.97% 11.80% 7.8% 1.66% 5.2% 2003 11.80% 7.8% 5.2% 28.36% 10.74% 1.03% 1.23% 2004 0.38% 4.49% 2.87% 11.80% 7.8% 7.8% 5.2% 5.2% 2005 4.83% 11.80% 3.01% 2006 15.61% 11.80% 1.96% 7.8% 4.68% 5.2% 2007 5.48% 10.21% 7.8% 4.64% 5.2% 11.80% 11.80% 2008 20.10% 7.8% 1.59% 5.2% -36.55% 25.94% 2009 11.80% - 11.12% 7.8% 0.14% 5.2% 2010 14.82% 11.80% 8.46% 7.8% 0.13% 5.2% 2011 2.10% 11.80% 16.04% 7.8% 0.03% 5.2% 2012 15.89% 11.80% 2.97% 7.8% 0.05% 5.2% 2013 32.15% 11.80% -9.10% 7.8% 0.07% 5.2% 1970- Arithmetic 2013 Mean 11.8% 7.8% 5.2%


