Part 2 Required:6.Calculate the tax effect on the loss of $50 million recognized in AOCI in 2018.
Additional FactsAssume that a valuation allowance of $100 million is recorded as of December 31, 2018 ($150 million DTA less $50 million reversing DTLs). Further, assume that the Companys projection for 2019 pretax book income of $0 is accurate, but the Company sells a component of the business and recognizes the component as a discontinued operation. The discontinued operations earn $20 million before tax, and the continuing operations lose $20 million before tax for a net pretax book income of $0. As described above, the Company has a full valuation allowance.
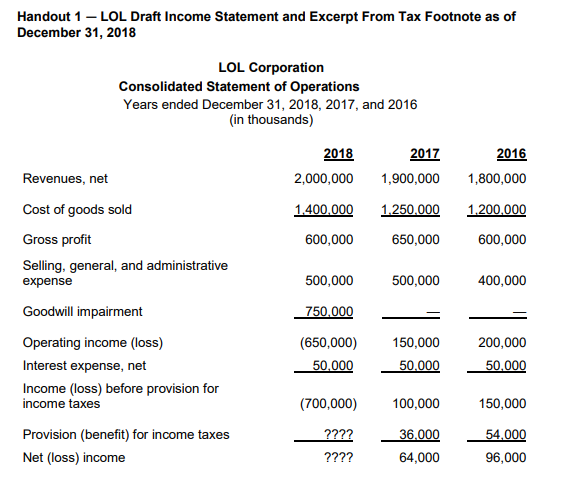
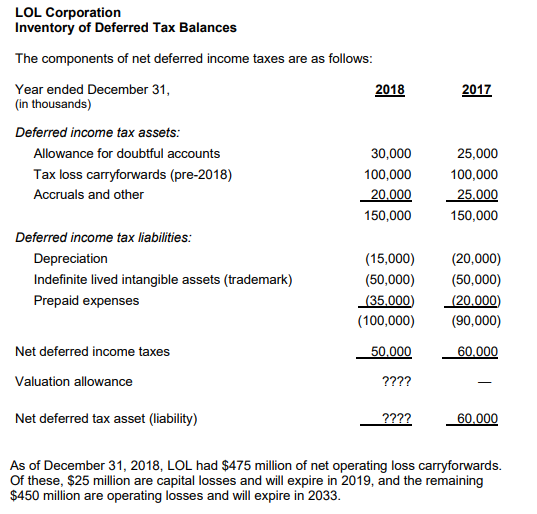
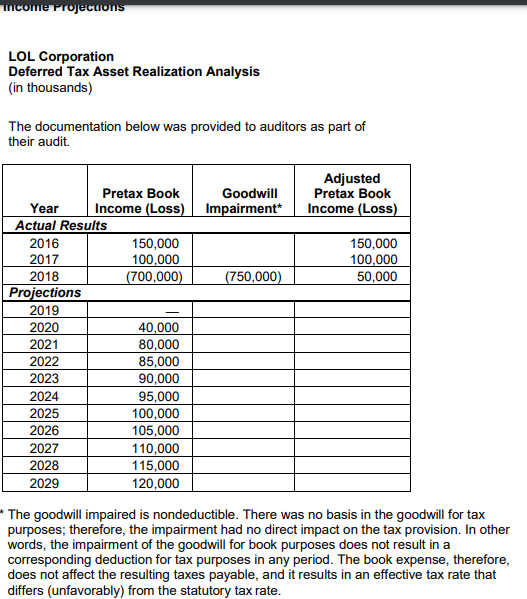
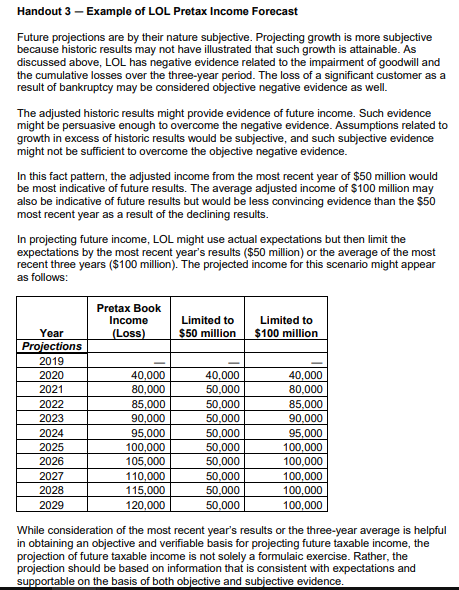
Handout 1 LOL Draft Income Statement and Excerpt From Tax Footnote as of December 31, 2018 LOL Corporation Consolidated Statement of Operations Years ended December 31, 2018, 2017, and 2016 (in thousands) 2018 2017 2,000,000 1,900,000 2016 Revenues, net 1,800,000 1.400.000 1.250.000 1.200,000 600,000 650,000 600,000 500,000 500,000 400,000 Cost of goods sold Gross profit Selling, general, and administrative expense Goodwill impairment Operating income (loss) Interest expense, net Income (loss) before provision for income taxes Provision (benefit) for income taxes Net (loss) income 750,000 (650,000) 50,000 150,000 50.000 200,000 50,000 (700,000) 100,000 150,000 ???? ???? 36.000 64,000 54,000 96,000 2017 30,000 LOL Corporation Inventory of Deferred Tax Balances The components of net deferred income taxes are as follows: Year ended December 31, 2018 (in thousands) Deferred income tax assets: Allowance for doubtful accounts Tax loss carryforwards (pre-2018) 100,000 Accruals and other 20.000 150,000 Deferred income tax liabilities: Depreciation (15,000) Indefinite lived intangible assets (trademark) (50,000) Prepaid expenses (35,000) (100,000) Net deferred income taxes 50.000 Valuation allowance ???? 25,000 100,000 25.000 150,000 (20,000) (50,000) (20.000) (90,000) 60.000 Net deferred tax asset liability) ???? 60.000 As of December 31, 2018, LOL had $475 million of net operating loss carryforwards. Of these, $25 million are capital losses and will expire in 2019, and the remaining $450 million are operating losses and will expire in 2033. Thcome Projections LOL Corporation Deferred Tax Asset Realization Analysis (in thousands) The documentation below was provided to auditors as part of their audit Goodwill Impairment* Adjusted Pretax Book Income (Loss) 150,000 100,000 50,000 (750,000) Pretax Book Year Income (Loss) Actual Results 2016 150,000 2017 100,000 2018 (700,000) Projections 2019 2020 40,000 2021 80,000 2022 85,000 2023 90,000 2024 95,000 2025 100,000 2026 105,000 2027 110,000 2028 115,000 2029 120,000 * The goodwill impaired is nondeductible. There was no basis in the goodwill for tax purposes; therefore, the impairment had no direct impact on the tax provision. In other words, the impairment of the goodwill for book purposes does not result in a corresponding deduction for tax purposes in any period. The book expense, therefore, does not affect the resulting taxes payable, and it results in an effective tax rate that differs (unfavorably) from the statutory tax rate. Handout 3 Example of LOL Pretax Income Forecast Future projections are by their nature subjective. Projecting growth is more subjective because historic results may not have illustrated that such growth is attainable. As discussed above, LOL has negative evidence related to the impairment of goodwill and the cumulative losses over the three-year period. The loss of a significant customer as a result of bankruptcy may be considered objective negative evidence as well. The adjusted historic results might provide evidence of future income. Such evidence might be persuasive enough to overcome the negative evidence. Assumptions related to growth in excess of historic results would be subjective, and such subjective evidence might not be sufficient to overcome the objective negative evidence. In this fact pattern, the adjusted income from the most recent year of $50 million would be most indicative of future results. The average adjusted income of $100 million may also be indicative of future results but would be less convincing evidence than the $50 most recent year as a result of the declining results. In projecting future income, LOL might use actual expectations but then limit the expectations by the most recent year's results ($50 million) or the average of the most recent three years ($100 million). The projected income for this scenario might appear as follows: Pretax Book Income (Loss) Limited to $50 million Limited to $100 million Year Projections 2019 2020 2021 2022 2023 2024 2025 2026 2027 2028 2029 40,000 80,000 85,000 90,000 95,000 100,000 105,000 110,000 115,000 120,000 40,000 50,000 50,000 50,000 50,000 50,000 50,000 50,000 50.000 50,000 40,000 80,000 85,000 90,000 95,000 100,000 100,000 100,000 100,000 100,000 While consideration of the most recent year's results or the three-year average is helpful in obtaining an objective and verifiable basis for projecting future taxable income, the projection of future taxable income is not solely a formulaic exercise. Rather, the projection should be based on information that is consistent with expectations and supportable on the basis of both objective and subjective evidence. Handout 1 LOL Draft Income Statement and Excerpt From Tax Footnote as of December 31, 2018 LOL Corporation Consolidated Statement of Operations Years ended December 31, 2018, 2017, and 2016 (in thousands) 2018 2017 2,000,000 1,900,000 2016 Revenues, net 1,800,000 1.400.000 1.250.000 1.200,000 600,000 650,000 600,000 500,000 500,000 400,000 Cost of goods sold Gross profit Selling, general, and administrative expense Goodwill impairment Operating income (loss) Interest expense, net Income (loss) before provision for income taxes Provision (benefit) for income taxes Net (loss) income 750,000 (650,000) 50,000 150,000 50.000 200,000 50,000 (700,000) 100,000 150,000 ???? ???? 36.000 64,000 54,000 96,000 2017 30,000 LOL Corporation Inventory of Deferred Tax Balances The components of net deferred income taxes are as follows: Year ended December 31, 2018 (in thousands) Deferred income tax assets: Allowance for doubtful accounts Tax loss carryforwards (pre-2018) 100,000 Accruals and other 20.000 150,000 Deferred income tax liabilities: Depreciation (15,000) Indefinite lived intangible assets (trademark) (50,000) Prepaid expenses (35,000) (100,000) Net deferred income taxes 50.000 Valuation allowance ???? 25,000 100,000 25.000 150,000 (20,000) (50,000) (20.000) (90,000) 60.000 Net deferred tax asset liability) ???? 60.000 As of December 31, 2018, LOL had $475 million of net operating loss carryforwards. Of these, $25 million are capital losses and will expire in 2019, and the remaining $450 million are operating losses and will expire in 2033. Thcome Projections LOL Corporation Deferred Tax Asset Realization Analysis (in thousands) The documentation below was provided to auditors as part of their audit Goodwill Impairment* Adjusted Pretax Book Income (Loss) 150,000 100,000 50,000 (750,000) Pretax Book Year Income (Loss) Actual Results 2016 150,000 2017 100,000 2018 (700,000) Projections 2019 2020 40,000 2021 80,000 2022 85,000 2023 90,000 2024 95,000 2025 100,000 2026 105,000 2027 110,000 2028 115,000 2029 120,000 * The goodwill impaired is nondeductible. There was no basis in the goodwill for tax purposes; therefore, the impairment had no direct impact on the tax provision. In other words, the impairment of the goodwill for book purposes does not result in a corresponding deduction for tax purposes in any period. The book expense, therefore, does not affect the resulting taxes payable, and it results in an effective tax rate that differs (unfavorably) from the statutory tax rate. Handout 3 Example of LOL Pretax Income Forecast Future projections are by their nature subjective. Projecting growth is more subjective because historic results may not have illustrated that such growth is attainable. As discussed above, LOL has negative evidence related to the impairment of goodwill and the cumulative losses over the three-year period. The loss of a significant customer as a result of bankruptcy may be considered objective negative evidence as well. The adjusted historic results might provide evidence of future income. Such evidence might be persuasive enough to overcome the negative evidence. Assumptions related to growth in excess of historic results would be subjective, and such subjective evidence might not be sufficient to overcome the objective negative evidence. In this fact pattern, the adjusted income from the most recent year of $50 million would be most indicative of future results. The average adjusted income of $100 million may also be indicative of future results but would be less convincing evidence than the $50 most recent year as a result of the declining results. In projecting future income, LOL might use actual expectations but then limit the expectations by the most recent year's results ($50 million) or the average of the most recent three years ($100 million). The projected income for this scenario might appear as follows: Pretax Book Income (Loss) Limited to $50 million Limited to $100 million Year Projections 2019 2020 2021 2022 2023 2024 2025 2026 2027 2028 2029 40,000 80,000 85,000 90,000 95,000 100,000 105,000 110,000 115,000 120,000 40,000 50,000 50,000 50,000 50,000 50,000 50,000 50,000 50.000 50,000 40,000 80,000 85,000 90,000 95,000 100,000 100,000 100,000 100,000 100,000 While consideration of the most recent year's results or the three-year average is helpful in obtaining an objective and verifiable basis for projecting future taxable income, the projection of future taxable income is not solely a formulaic exercise. Rather, the projection should be based on information that is consistent with expectations and supportable on the basis of both objective and subjective evidence


