

Answered step by step
Verified Expert Solution
Question
1 Approved Answer
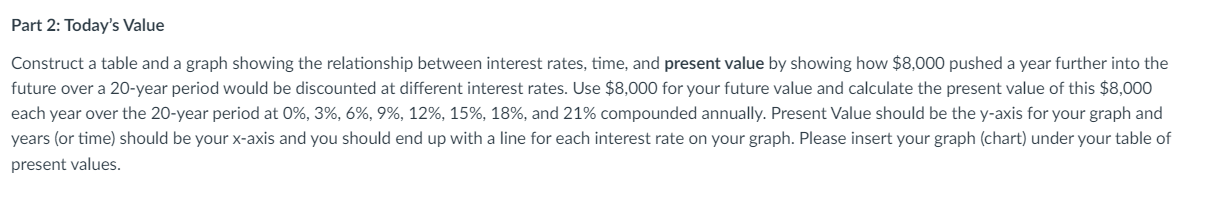
Part 2: Today's Value Construct a table and a graph showing the relationship between interest rates, time, and present value by showing how $8,000 pushed
Step by Step Solution
There are 3 Steps involved in it
Step: 1

Get Instant Access to Expert-Tailored Solutions
See step-by-step solutions with expert insights and AI powered tools for academic success
Step: 2

Step: 3
Ace Your Homework with AI
Get the answers you need in no time with our AI-driven, step-by-step assistance
Get Started
Essentials Of Finance
Authors: Kent A. Hickman, John W. Byrd , Matthew McPherson
1st Edition
1621782999