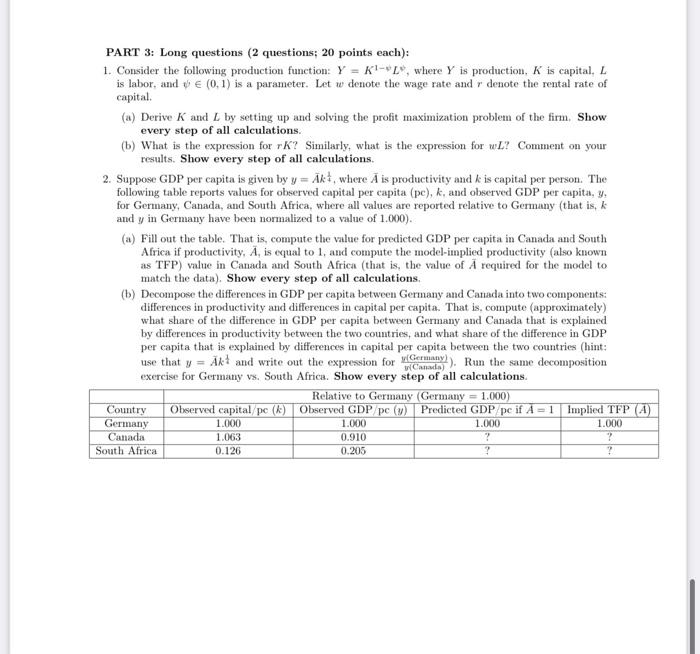
PART 3: Long questions ( 2 questions; 20 points each): 1. Consider the following production function: Y=K1L, where Y is production, K is capital, L is labor, and (0,1) is a parameter. Let w denote the wage rate and r denote the rental rate of capital. (a) Derive K and L by setting up and solving the profit maximization problem of the firm. Show every step of all calculations. (b) What is the expression for rK ? Similarly, what is the expression for wL ? Comment on your results. Show every step of all calculations. 2. Suppose GDP per capita is given by y=Ak41, where A is productivity and k is capital per person. The following table reports values for observed capital per capita (pc), k, and observed GDP per capita, y, for Germany, Canada, and South Africa, where all values are reported relative to Germany (that is, k and y in Germany have been normalized to a value of 1.000 ). (a) Fill out the table. That is, compute the value for predicted GDP per capita in Canada and South Africa if productivity, A, is equal to 1 , and compute the model-implied productivity (also known as TFP) value in Camada and South Africa (that is, the value of A required for the model to match the data). Show every step of all calculations. (b) Decompose the differences in GDP per capita between Germany and Catada into two components: differences in productivity and differences in capital per capita. That is, compute (approximately) what share of the difference in GDP per capita between Germany and Canada that is explained by differences in productivity between the two countries, and what share of the difference in GDP per capita that is explained by differences in capital per capita between the two countries (hint: exercise for Germany vs. South Africa. Show every step of all calculations. PART 3: Long questions ( 2 questions; 20 points each): 1. Consider the following production function: Y=K1L, where Y is production, K is capital, L is labor, and (0,1) is a parameter. Let w denote the wage rate and r denote the rental rate of capital. (a) Derive K and L by setting up and solving the profit maximization problem of the firm. Show every step of all calculations. (b) What is the expression for rK ? Similarly, what is the expression for wL ? Comment on your results. Show every step of all calculations. 2. Suppose GDP per capita is given by y=Ak41, where A is productivity and k is capital per person. The following table reports values for observed capital per capita (pc), k, and observed GDP per capita, y, for Germany, Canada, and South Africa, where all values are reported relative to Germany (that is, k and y in Germany have been normalized to a value of 1.000 ). (a) Fill out the table. That is, compute the value for predicted GDP per capita in Canada and South Africa if productivity, A, is equal to 1 , and compute the model-implied productivity (also known as TFP) value in Camada and South Africa (that is, the value of A required for the model to match the data). Show every step of all calculations. (b) Decompose the differences in GDP per capita between Germany and Catada into two components: differences in productivity and differences in capital per capita. That is, compute (approximately) what share of the difference in GDP per capita between Germany and Canada that is explained by differences in productivity between the two countries, and what share of the difference in GDP per capita that is explained by differences in capital per capita between the two countries (hint: exercise for Germany vs. South Africa. Show every step of all calculations


