Answered step by step
Verified Expert Solution
Question
1 Approved Answer
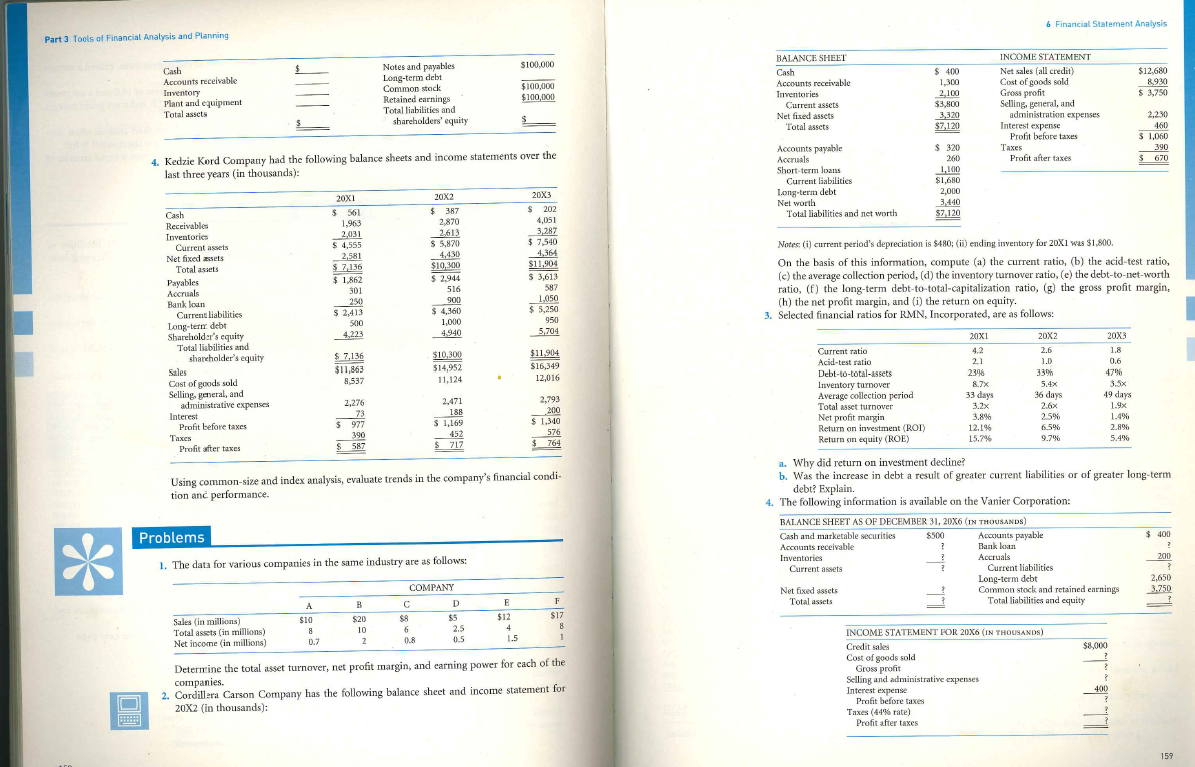
Part 3 Tools of Financial Analysis and Planning 10 Cash Accounts receivable Inventory Plant and equipment Total assets Cash Receivables Inventories 4. Kedzie Kord


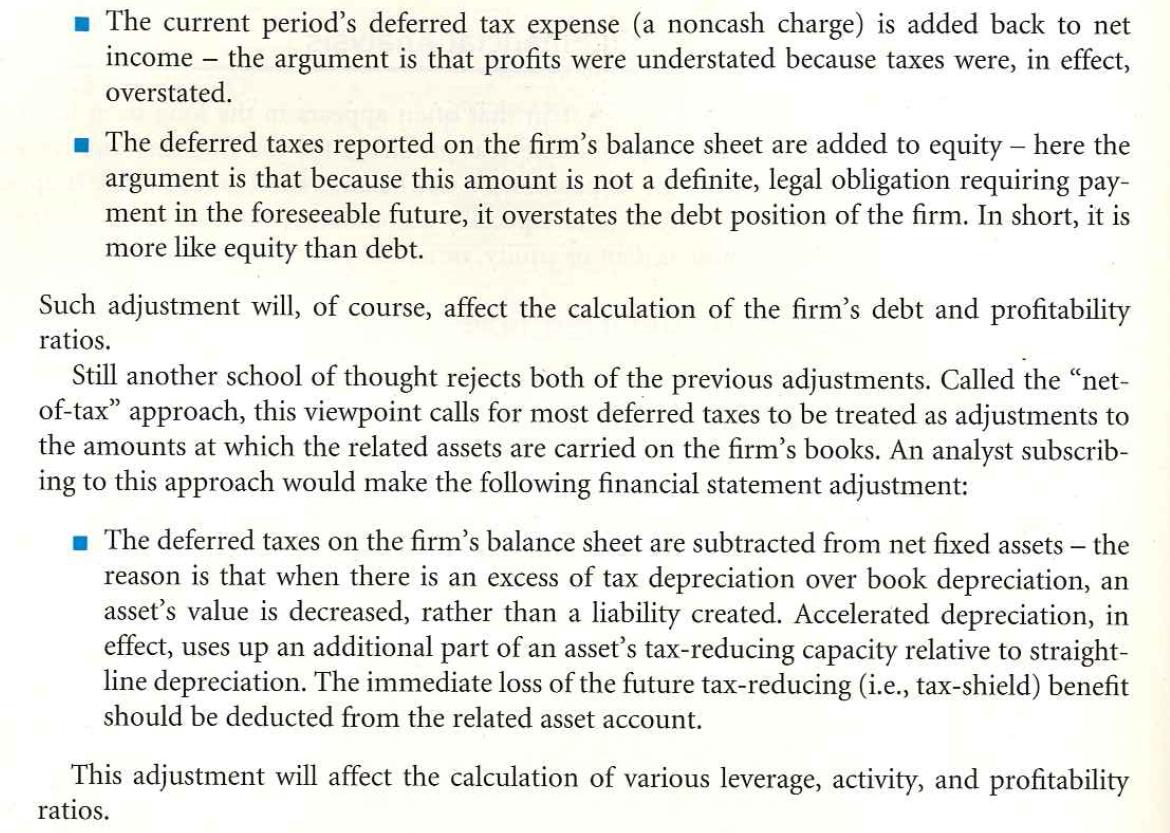
Part 3 Tools of Financial Analysis and Planning 10 Cash Accounts receivable Inventory Plant and equipment Total assets Cash Receivables Inventories 4. Kedzie Kord Company had the following balance sheets and income statements over the last three years (in thousands): Current assets Net fixed assets Total assets. Payables Accruals Bank loan Current liabilities Long-term debt Shareholder's equity Total liabilities and shareholder's equity Sales Cost of goods sold Selling, general, and administrative expenses Interest Profit before taxes Taxes Profit after taxes Sales (in millions) Total assets (in millions) Net income (in millions) A 20X1 $ 561 1,963 2,031 $ 4,555 2,581 $ 7,136 $10 $ 1,862 301 250 $ 2,413 500 4,223 8 0.7 $ 7,136 $11,863 8,537 2,276 73 $ 977 390 $ 587 Notes and payables Long-term debt Common stock Retained earnings Total liabilities and shareholders' equity B $20 10 2 Problems 1. The data for various companies in the same industry are as follows: 20X2 $387 2,870 2,613 $ 5,870 C $8 4,430 $10,300 $ 2,944 516 6 0.8 900 $ 4,360 1,000 4.940 $10,300 $14,952 11,124 Using common-size and index analysis, evaluate trends in the company's financial condi- tion and performance. 2,471 188 $ 1,169 452 $717 COMPANY D $5 $100,000 $100,000 $100,000 $ 2.5 0.5 E $12 4 1.5 20X3 $ 202 4,051 3,287 $ 7,540 4,364 $11,904 $ 3,613 587 1,050 $5,250 950 5,704 $11.904 $16,349 12,016 2,793 200 $ 1,340 576 $ 764 F $17 8 1 Determine the total asset turnover, net profit margin, and earning power for each of the companies. 2. Cordillera Carson Company has the following balance sheet and income statement for 20X2 (in thousands): BALANCE SHEET Cash Accounts receivable Inventories Current assets Net fixed assets Total assets Accounts payable Accruals Short-term loans Current liabilities Long-term debt Net worth Total liabilities and net worth Current ratio Curatio Acid-test ratio Debt-to-total-assets Inventory turnover Average collection period Total asset turnover Net profit margin Return on investment (ROI) Return on equity (ROE) Current assets Net fixed assets Total assets $ 400 1,300 2,100 $3,800 3,320 $7,120 Notes: (i) current period's depreciation is $480; (ii) ending inventory for 20X1 was $1,800. On the basis of this information, compute (a) the current ratio, (b) the acid-test ratio, (c) the average collection period, (d) the inventory turnover ratio, (e) the debt-to-net-worth ratio, (f) the long-term debt-to-total-capitalization ratio, (g) the gross profit margin, (h) the net profit margin, and (i) the return on equity. 3. Selected financial ratios for RMN, Incorporated, are as follows: $ 320 260 1,100 $1,680 2,000 3,440 $7,120 BALANCE SHEET AS OF DECEMBER 31, 20X6 (IN THOUSANDS) Cash and marketable securities $500 Accounts receivable ? Inventories ? ? Profit before taxes 20X1 4.2 2.1 2396 Taxes (44% rate) 8.7x 33 days 3.2x 3.8% 12.1% 15.7% Profit after taxes INCOME STATEMENT Net sales (all credit) Cost of goods sold Gross profit Selling, general, and administration expenses Interest expense Profit before taxes Taxes Profit after taxes 6 Financial Statement Analysis Selling and administrative expenses Interest expense 20X2 2.6 1.0 33% INCOME STATEMENT FOR 20X6 (IN THOUSANDS) Credit sales Cost of goods sold Gross profit 5.4x 36 days. 2.6x 2.5% 6.5% 9.7% a. Why did return on investment decline? b. Was the increase in debt a result of greater current liabilities or of greater long-term debt? Explain. 4. The following information is available on the Vanier Corporation: Accounts payable Bank loan Accruals Current liabilities Long-term debt 20X3 1.8 0.6 47% 49 days 1.9x 1.4% 3.5x Common stock and retained earnings Total liabilities and equity $8,000 2.8% 5.4% 400 $12,680 8,930 $ 3,750 2,230 460 $ 1,060 390 $ 670 $ 400 ? 200 ? 2,650 3.750 159 The current period's deferred tax expense (a noncash charge) is added back to net income the argument is that profits were understated because taxes were, in effect, overstated. - The deferred taxes reported on the firm's balance sheet are added to equity - here the argument is that because this amount is not a definite, legal obligation requiring pay- ment in the foreseeable future, it overstates the debt position of the firm. In short, it is more like equity than debt. Such adjustment will, of course, affect the calculation of the firm's debt and profitability ratios. Still another school of thought rejects both of the previous adjustments. Called the "net- of-tax" approach, this viewpoint calls for most deferred taxes to be treated as adjustments to the amounts at which the related assets are carried on the firm's books. An analyst subscrib- ing to this approach would make the following financial statement adjustment: The deferred taxes on the firm's balance sheet are subtracted from net fixed assets - the reason is that when there is an excess of tax depreciation over book depreciation, an asset's value is decreased, rather than a liability created. Accelerated depreciation, in effect, uses up an additional part of an asset's tax-reducing capacity relative to straight- line depreciation. The immediate loss of the future tax-reducing (i.e., tax-shield) benefit should be deducted from the related asset account. This adjustment will affect the calculation of various leverage, activity, and profitability ratios. 1. What is the purpose of a balance sheet? An income statement? 2. Why is the analysis of trends in financial ratios important? 3. Auxier Manufacturing Company has a current ratio of 4 to 1 but is unable to pay its bills. Why? 4. Can a firm generate a 25 percent return on assets and still be technically insolvent (unable to pay its bills)? Explain. 5. The traditional definitions of collection period and inventory turnover are criticized because in both cases balance sheet figures that are a result of approximately the last month of sales are related to annual sales (in the former case) or annual cost of goods sold (in the latter case). Why do these definitions present problems? Suggest a solution. 6. Explain why a long-term creditor should be interested in liquidity ratios. 7. Which financial ratios would you be most likely to consult if you were the following? Why? a. A banker considering the financing of seasonal inventory b. A wealthy equity investor c. The manager of a pension fund considering the purchase of a firm's bonds d. The president of a consumer products firm 8. In trying to judge whether a company has too much debt, what financial ratios would you use and for what purpose? 9. Why might it be possible for a company to make large operating profits, yet still be unable to meet debt payments when due? What financial ratios might be employed to detect such a condition? 10. Does increasing a firm's inventory turnover ratio increase its profitability? Why should this ratio be computed using cost of goods sold (rather than sales, as is done by some compilers of financial statistics)?
Step by Step Solution
★★★★★
3.46 Rating (153 Votes )
There are 3 Steps involved in it
Step: 1
In this section you have provided a set of questions related to financial analysis financial statements and ratios I will provide responses to the questions you have listed 1 Why did return on investm...
Get Instant Access to Expert-Tailored Solutions
See step-by-step solutions with expert insights and AI powered tools for academic success
Step: 2

Step: 3

Ace Your Homework with AI
Get the answers you need in no time with our AI-driven, step-by-step assistance
Get Started


