

Question
Part 3 Using the Score Financial Projections Template (See Below) analyze the pictures in their entirety for any aspects that may not be obvious to
 Part 3 Using the Score Financial Projections Template (See Below) analyze the pictures in their entirety for any aspects that may not be obvious to the common financial statement user. Explain each of these areas of possible confusion.Also,Please provide assumptions regarding financial statement content monthly for the first year. The spreadsheet did not show up on word like I wanted it to. If the person looking at this would like a copy of the excel spreadsheet I would be happy to send it to them.
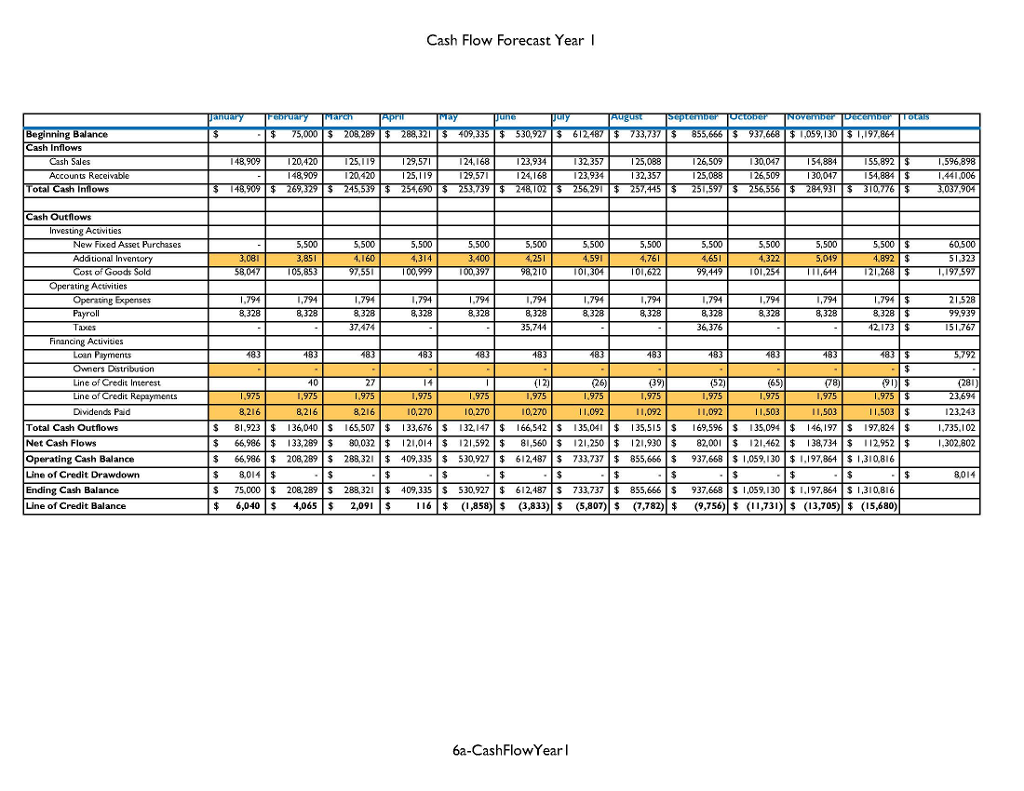
| Cash Flow Forecast Year 1 | |||||||||||||
| Prepared By: | Company Name: | ||||||||||||
| Owner | Company 1 | ||||||||||||
| Month 1 | Month 2 | Month 3 | Month 4 | Month 5 | Month 6 | Month 7 | Month 8 | Month 9 | Month 10 | Month 11 | Month 12 | Totals | |
| Beginning Balance | $ - | $ 75,000 | $ 208,289 | $ 288,321 | $ 409,335 | $ 530,927 | $ 612,487 | $ 733,737 | $ 855,666 | $ 937,668 | $1,059,130 | $1,197,864 | |
| Cash Inflows | |||||||||||||
| Cash Sales | 148,909 | 120,420 | 125,119 | 129,571 | 124,168 | 123,934 | 132,357 | 125,088 | 126,509 | 130,047 | 154,884 | 155,892 | $ 1,596,898 |
| Accounts Receivable | - | 148,909 | 120,420 | 125,119 | 129,571 | 124,168 | 123,934 | 132,357 | 125,088 | 126,509 | 130,047 | 154,884 | $ 1,441,006 |
| Total Cash Inflows | $ 148,909 | $ 269,329 | $ 245,539 | $ 254,690 | $ 253,739 | $ 248,102 | $ 256,291 | $ 257,445 | $ 251,597 | $ 256,556 | $ 284,931 | $ 310,776 | $ 3,037,904 |
| Cash Outflows | |||||||||||||
| Investing Activities | |||||||||||||
| New Fixed Asset Purchases | - | 5,500 | 5,500 | 5,500 | 5,500 | 5,500 | 5,500 | 5,500 | 5,500 | 5,500 | 5,500 | 5,500 | $ 60,500 |
| Additional Inventory | 3,081 | 3,851 | 4,160 | 4,314 | 3,400 | 4,251 | 4,591 | 4,761 | 4,651 | 4,322 | 5,049 | 4,892 | $ 51,323 |
| Cost of Goods Sold | 58,047 | 105,853 | 97,551 | 100,999 | 100,397 | 98,210 | 101,304 | 101,622 | 99,449 | 101,254 | 111,644 | 121,268 | $ 1,197,597 |
| Operating Activities | |||||||||||||
| Operating Expenses | 1,794 | 1,794 | 1,794 | 1,794 | 1,794 | 1,794 | 1,794 | 1,794 | 1,794 | 1,794 | 1,794 | 1,794 | $ 21,528 |
| Payroll | 8,328 | 8,328 | 8,328 | 8,328 | 8,328 | 8,328 | 8,328 | 8,328 | 8,328 | 8,328 | 8,328 | 8,328 | $ 99,939 |
| Taxes | - | - | 37,474 | - | - | 35,744 | - | - | 36,376 | - | - | 42,173 | $ 151,767 |
| Financing Activities | |||||||||||||
| Loan Payments | 483 | 483 | 483 | 483 | 483 | 483 | 483 | 483 | 483 | 483 | 483 | 483 | $ 5,792 |
| Owners Distribution | - | - | - | - | - | - | - | - | - | - | - | - | $ - |
| Line of Credit Interest | 40 | 27 | 14 | 1 | (12) | (26) | (39) | (52) | (65) | (78) | (91) | $ (281) | |
| Line of Credit Repayments | 1,975 | 1,975 | 1,975 | 1,975 | 1,975 | 1,975 | 1,975 | 1,975 | 1,975 | 1,975 | 1,975 | 1,975 | $ 23,694 |
| Dividends Paid | 8,216 | 8,216 | 8,216 | 10,270 | 10,270 | 10,270 | 11,092 | 11,092 | 11,092 | 11,503 | 11,503 | 11,503 | $ 123,243 |
| Total Cash Outflows | $ 81,923 | $ 136,040 | $ 165,507 | $ 133,676 | $ 132,147 | $ 166,542 | $ 135,041 | $ 135,515 | $ 169,596 | $ 135,094 | $ 146,197 | $ 197,824 | $ 1,735,102 |
| Net Cash Flows | $ 66,986 | $ 133,289 | $ 80,032 | $ 121,014 | $ 121,592 | $ 81,560 | $ 121,250 | $ 121,930 | $ 82,001 | $ 121,462 | $ 138,734 | $ 112,952 | $ 1,302,802 |
| Operating Cash Balance | $ 66,986 | $ 208,289 | $ 288,321 | $ 409,335 | $ 530,927 | $ 612,487 | $ 733,737 | $ 855,666 | $ 937,668 | $1,059,130 | $1,197,864 | $1,310,816 | |
| Line of Credit Drawdown | $ 8,014 | $ - | $ - | $ - | $ - | $ - | $ - | $ - | $ - | $ - | $ - | $ - | $ 8,014 |
| Ending Cash Balance | $ 75,000 | $ 208,289 | $ 288,321 | $ 409,335 | $ 530,927 | $ 612,487 | $ 733,737 | $ 855,666 | $ 937,668 | $1,059,130 | $1,197,864 | $1,310,816 | |
| Line of Credit Balance | $ 6,040 | $ 4,065 | $ 2,091 | $ 116 | $ (1,858) | $ (3,833) | $ (5,807) | $ (7,782) | $ (9,756) | $ (11,731) | $ (13,705) | $ (15,680) | |
Step by Step Solution
There are 3 Steps involved in it
Step: 1

Get Instant Access to Expert-Tailored Solutions
See step-by-step solutions with expert insights and AI powered tools for academic success
Step: 2

Step: 3
Ace Your Homework with AI
Get the answers you need in no time with our AI-driven, step-by-step assistance
Get Started
Accounting Ethics
Authors: Iris Stuart
1st Edition
1118542401, 9781118542408