

Question
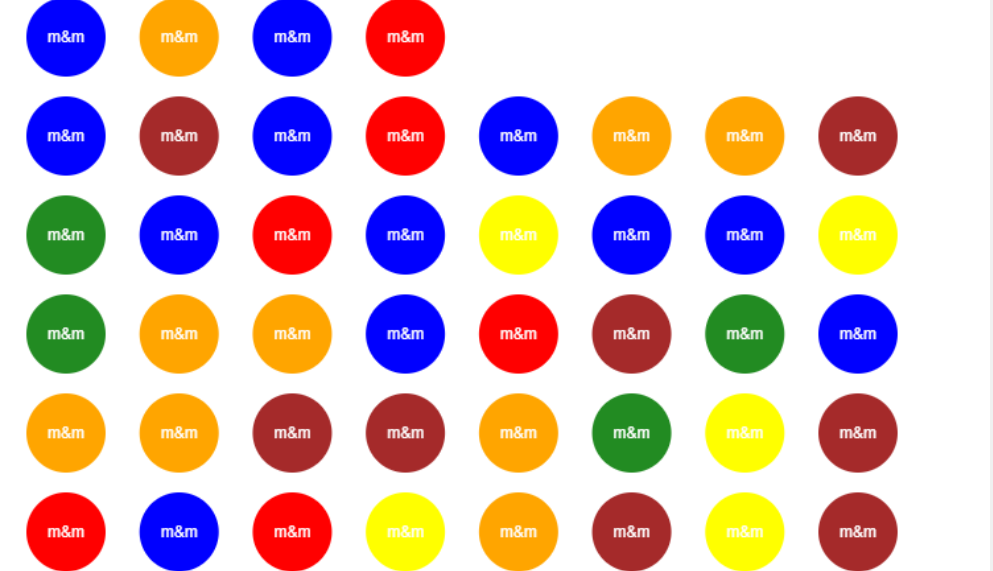
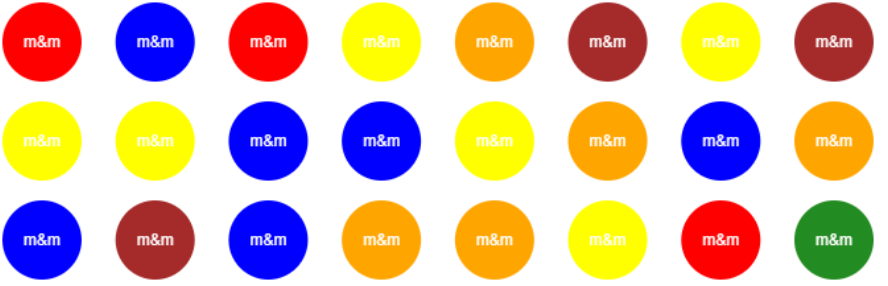
Part (a): a discrete probability distribution using the generated data from the following simulator: Anderson, D. Bag of M&M simulator . New Jersey Factory. Click
Part (a): a discrete probability distribution using the generated data from the following simulator: Anderson, D. Bag of M&M simulator. New Jersey Factory. Click on the simulator to scramble the colors of the M&Ms. Next, add the image of your generated results to the following MS Word document: Discrete Probability Distributions.docx Discrete Probability Distributions.docx - Alternative Formats .Use the table in this document to record the frequency of each color. Then, compute the relative frequency for each color and include the results in the table.
Part (b): Compute the mean and standard deviation (using StatCrunch or the formulas) for the discrete random variable given in the table from part (a). Include your results in the MS Word document.
Step by Step Solution
There are 3 Steps involved in it
Step: 1

Get Instant Access to Expert-Tailored Solutions
See step-by-step solutions with expert insights and AI powered tools for academic success
Step: 2

Step: 3
Ace Your Homework with AI
Get the answers you need in no time with our AI-driven, step-by-step assistance
Get Started
Applied Linear Algebra
Authors: Peter J. Olver, Cheri Shakiban
1st edition
131473824, 978-0131473829