Answered step by step
Verified Expert Solution
Question
1 Approved Answer
Part A: Unemployment a. The following table shows some labour characteristics for a sub-group of the Canadian population in 1978, 1994, 2010 and 2018 (Statistics
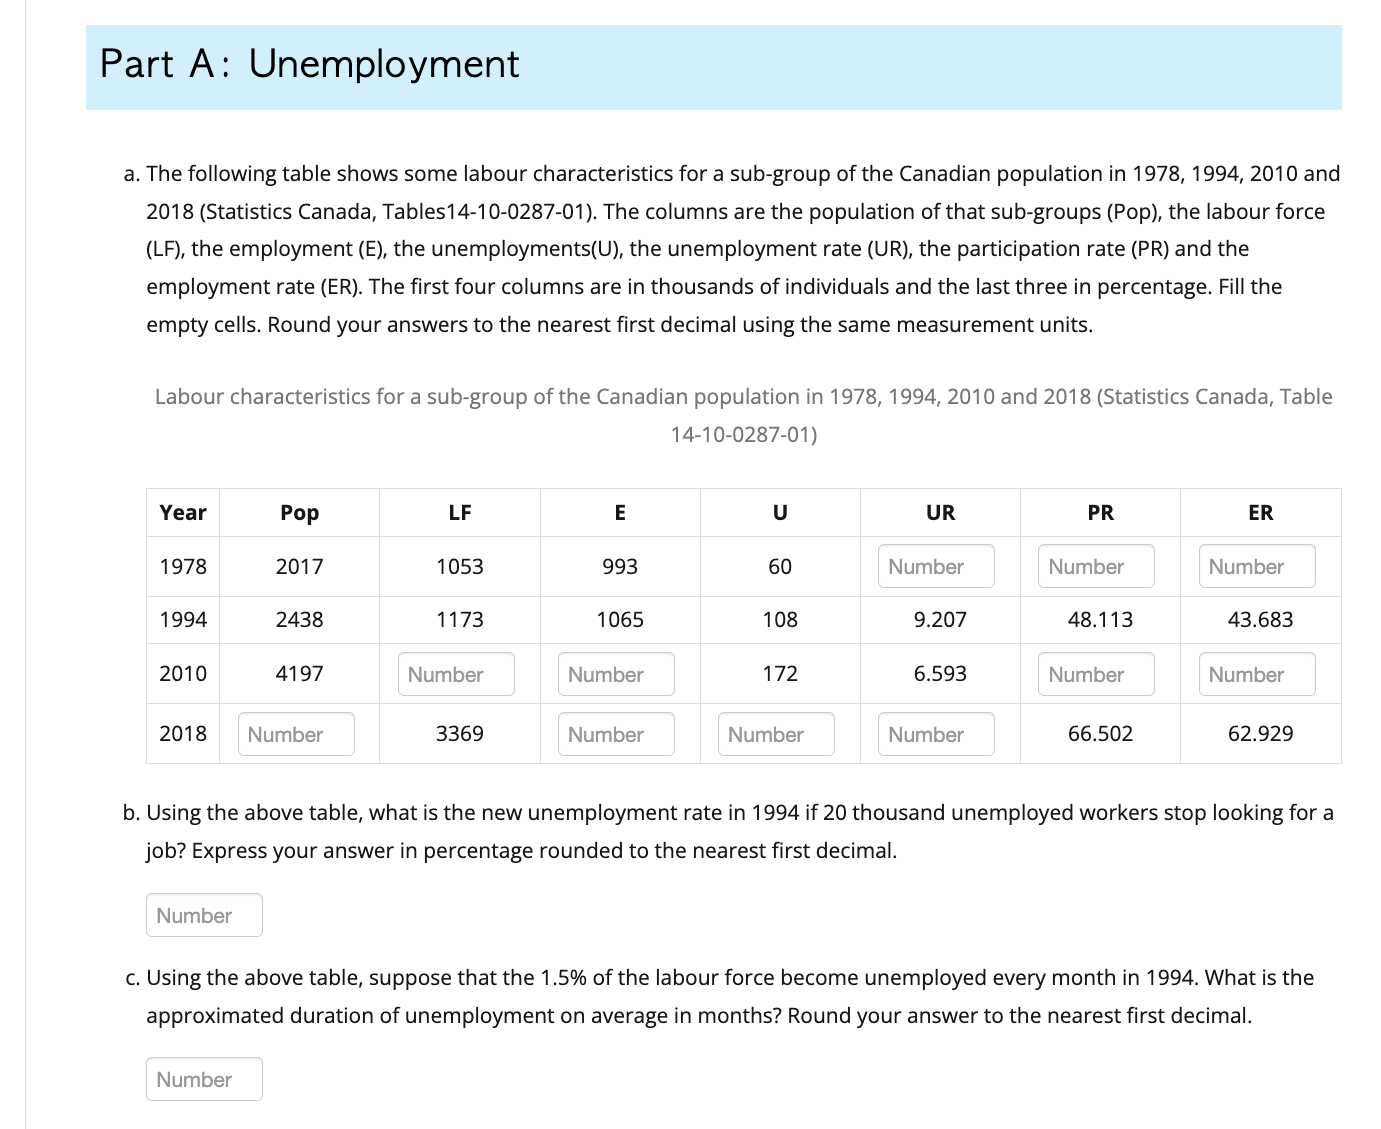
Part A: Unemployment a. The following table shows some labour characteristics for a sub-group of the Canadian population in 1978, 1994, 2010 and 2018 (Statistics Canada, Tables14-10-0287-01). The columns are the population of that sub-groups (Pop), the labour force (LF), the employment (E), the unemployments(U), the unemployment rate (UR), the participation rate (PR) and the employment rate (ER). The first four columns are in thousands of individuals and the last three in percentage. Fill the empty cells. Round your answers to the nearest first decimal using the same measurement units. Labour characteristics for a sub-group of the Canadian population in 1978, 1994, 2010 and 2018 (Statistics Canada, Table 14-10-0287-01) Year Pop LF E U UR PR ER 1978 2017 1053 993 60 Number Number Number 1994 2438 1173 1065 108 9.207 48.113 43.683 2010 4197 Number Number 172 6.593 Number Number 2018 Number 3369 Number Number Number 66.502 62.929 b. Using the above table, what is the new unemployment rate in 1994 if 20 thousand unemployed workers stop looking for a job? Express your answer in percentage rounded to the nearest first decimal. Number . Using the above table, suppose that the 1.5% of the labour force become unemployed every month in 1994. What is the approximated duration of unemployment on average in months? Round your answer to the nearest first decimal. Number
Step by Step Solution
There are 3 Steps involved in it
Step: 1
Get Instant Access to Expert-Tailored Solutions
See step-by-step solutions with expert insights and AI powered tools for academic success
Step: 2
Step: 3
Ace Your Homework with AI
Get the answers you need in no time with our AI-driven, step-by-step assistance
Get Started