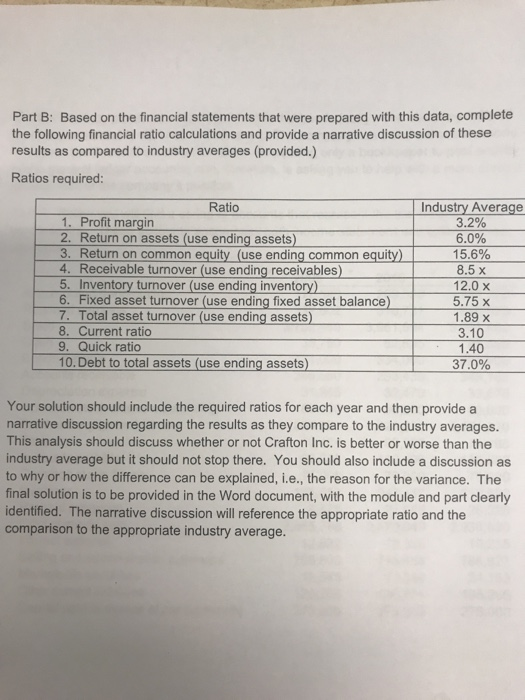
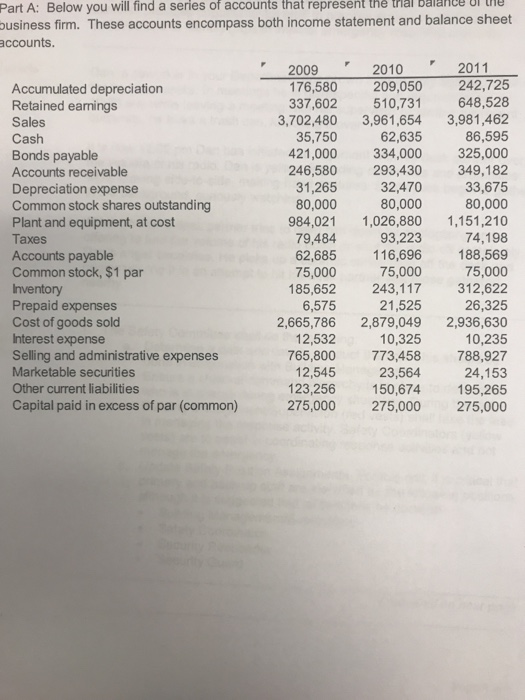
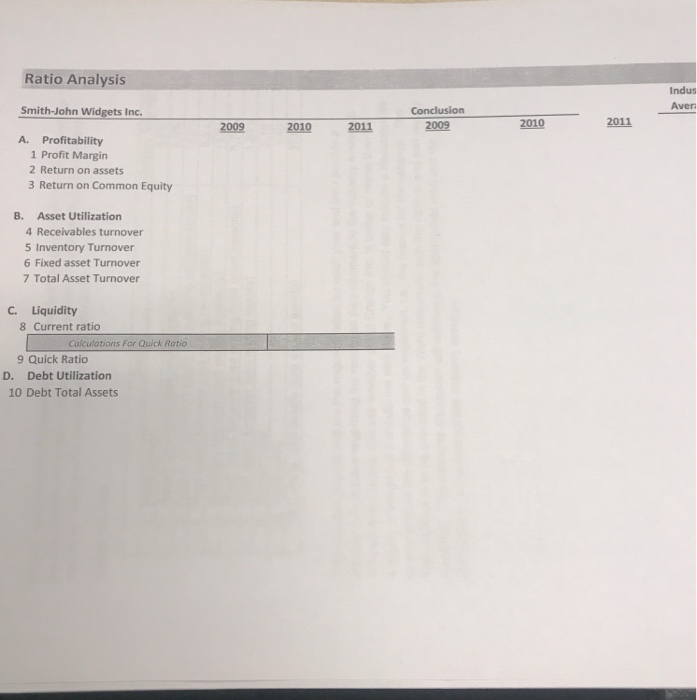
Part B: Based on the financial statements that were prepared with this data, complete the following financial ratio calculations and provide a narrative discussion of these results as compared to industry averages (provided.) Ratios required: Ratio 1. Profit margin 2. Return on assets (use ending assets) 3. Return on common equity (use ending common equity) 4. Receivable turnover (use ending receivables) 5. Inventory turnover (use ending inventory) 6. Fixed asset turnover (use ending fixed asset balance 7. Total asset turnover (use ending assets) 8. Current ratio 9. Quick ratio 10.Debt to total assets (use ending assets) Industry Average 3.2% 6.0% 15.6% 8.5 x 12.0 x 5.75 X 1.89 x 3.10 1.40 37.0% Your solution should include the required ratios for each year and then provide a narrative discussion regarding the results as they compare to the industry averages. This analysis should discuss whether or not Crafton Inc. is better or worse than the industry average but it should not stop there. You should also include a discussion as to why or how the difference can be explained, i.e., the reason for the variance. The final solution is to be provided in the Word document, with the module and part clearly identified. The narrative discussion will reference the appropriate ratio and the comparison to the appropriate industry average. Part A: Below you will find a series of accounts that represent the una balance ure business firm. These accounts encompass both income statement and balance sheet accounts. Accumulated depreciation Retained earnings Sales Cash Bonds payable Accounts receivable Depreciation expense Common stock shares outstanding Plant and equipment, at cost Taxes 2009 176,580 337,602 3,702,480 35,750 421,000 246,580 31,265 80,000 984,021 79,484 62,685 75,000 185,652 6,575 2,665,786 12,532 765,800 12,545 123,256 275,000 2010 209,050 510,731 3,961,654 62,635 334,000 293,430 32,470 80,000 1,026,880 93,223 116,696 75,000 243,117 21,525 2,879,049 10,325 773,458 23,564 150,674 275,000 2011 242,725 648,528 3,981,462 86,595 325,000 349,182 33,675 80,000 1,151,210 74,198 188,569 75,000 312,622 26,325 2,936,630 10,235 788,927 24,153 195,265 275,000 Accounts payable Common stock, $1 par Inventory Prepaid expenses Cost of goods sold Interest expense Selling and administrative expenses Marketable securities Other current liabilities Capital paid in excess of par (common) Ratio Analysis Indus Aver Smith-John Widgets Inc. 2011 Conclusion 2009 conclusion 2010 2011 2009 2010 2011 2011 A. Profitability 1 Profit Margin 2 Return on assets 3 Return on Common Equity B. Asset Utilization 4 Receivables turnover 5 Inventory Turnover 6 Fixed asset Turnover 7 Total Asset Turnover C. Liquidity 8 Current ratio Calculations For Quick Ratio 9 Quick Ratio D. Debt Utilization 10 Debt Total Assets