

Answered step by step
Verified Expert Solution
Question
1 Approved Answer
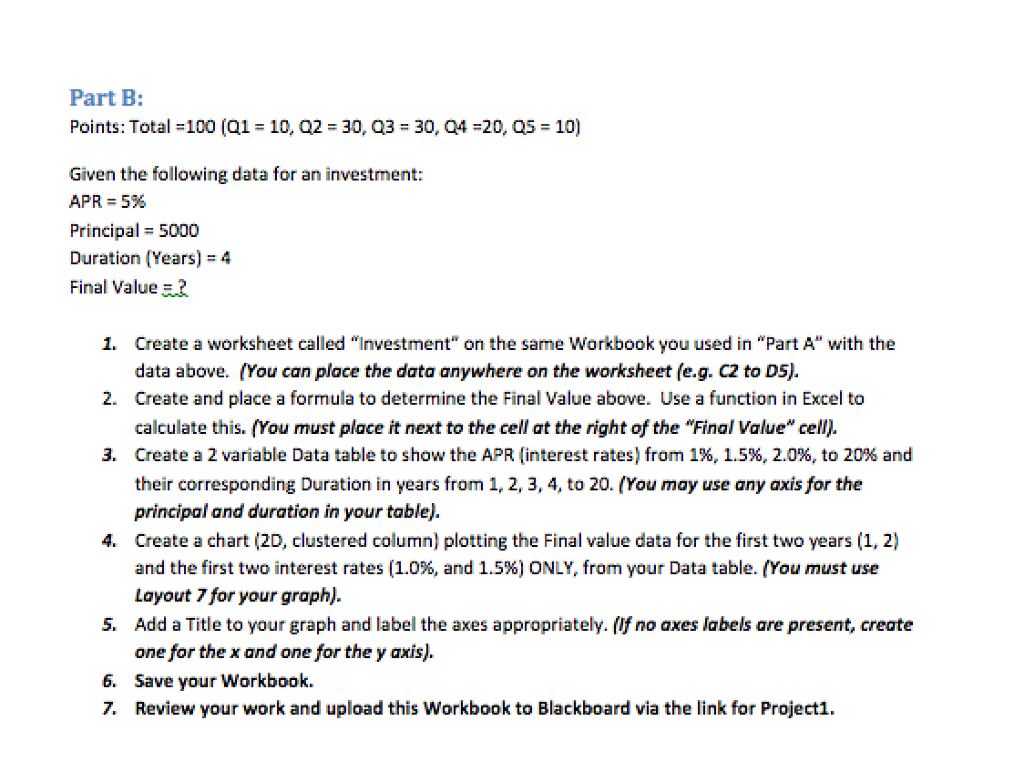
Part B: Points: Total 100 (Q110, 02 30, Q3 30, Q4 20, Q5-10) Given the following data for an investment: Principal 5000 Duration (Years)4 Final
Step by Step Solution
There are 3 Steps involved in it
Step: 1

Get Instant Access to Expert-Tailored Solutions
See step-by-step solutions with expert insights and AI powered tools for academic success
Step: 2

Step: 3
Ace Your Homework with AI
Get the answers you need in no time with our AI-driven, step-by-step assistance
Get Started
Database In Depth Relational Theory For Practitioners
Authors: C.J. Date
1st Edition
0596100124, 978-0596100124