 Part C is needed
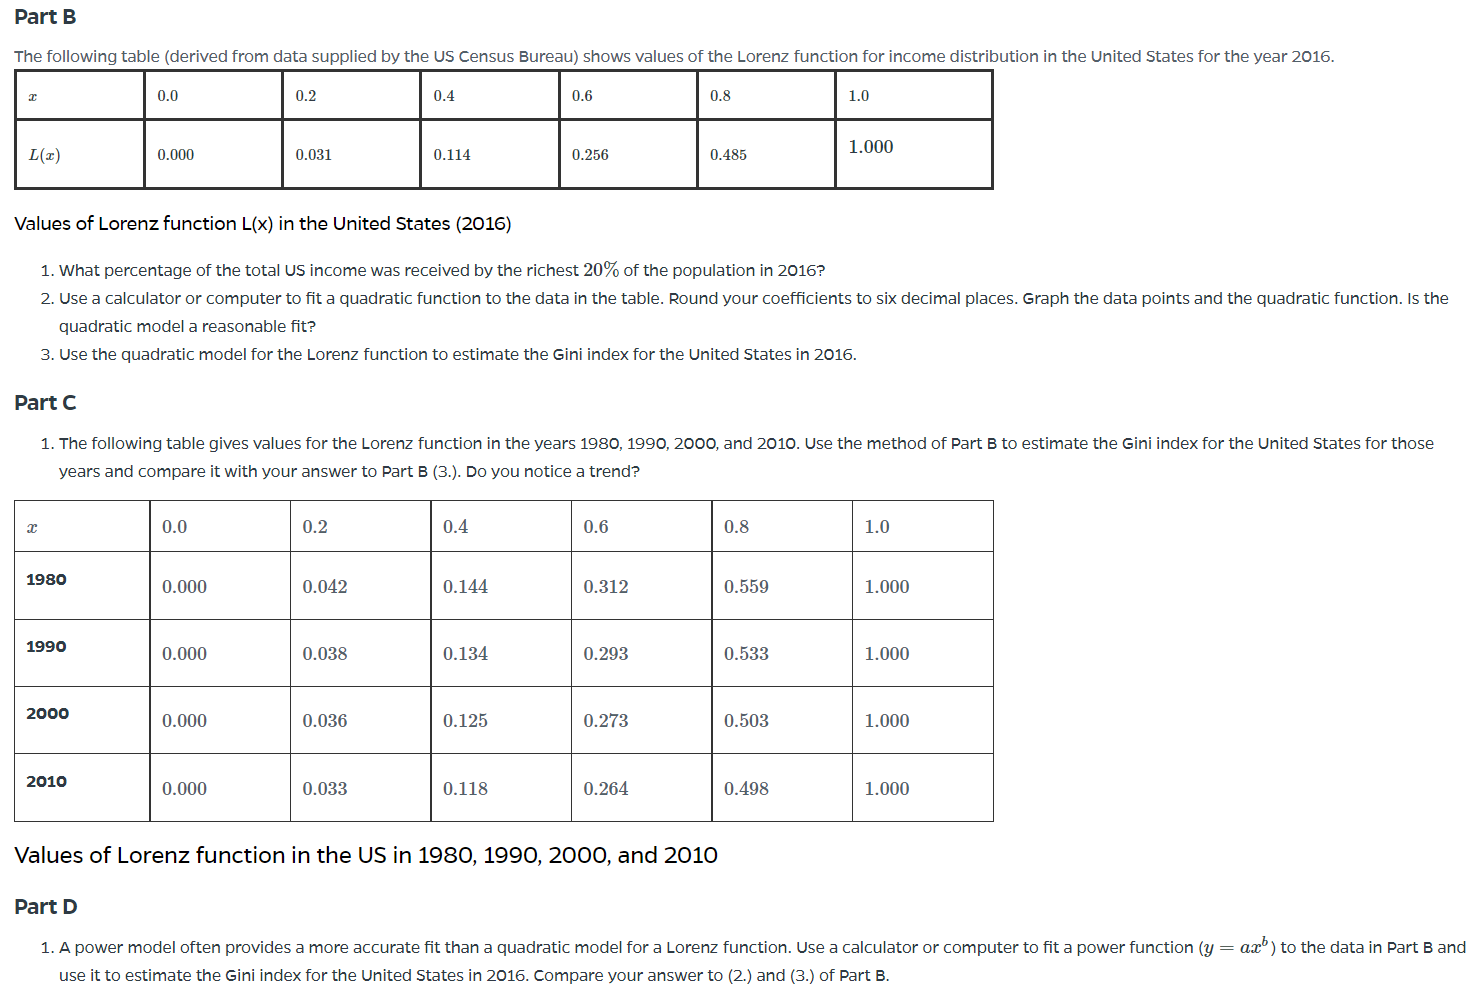
Part B The following table (derived from data supplied by the US Census Bureau) shows values of the Lorenz function for income distribution in the United States for the year 2016. 2 0.0 0.2 0.4 0.6 0.8 1.0 L(2) 0.000 0.031 0.114 0.256 1.000 0.485 Values of Lorenz function L(x) in the United States (2016) 1. What percentage of the total US income was received by the richest 20% of the population in 2016? 2. Use a calculator or computer to fit a quadratic function to the data in the table. Round your coefficients to six decimal places. Graph the data points and the quadratic function. Is the quadratic model a reasonable fit? 3. Use the quadratic model for the Lorenz function to estimate the Gini index for the United States in 2016. Part C 1. The following table gives values for the Lorenz function in the years 1980, 1990, 2000, and 2010. Use the method of Part B to estimate the Gini index for the United States for those years and compare it with your answer to Part B (3.). Do you notice a trend? 2 0.0 0.2 0.4 0.6 0.8 1.0 1980 0.000 0.042 0.144 0.312 0.559 1.000 1990 0.000 0.038 0.134 0.293 0.533 1.000 2000 0.000 0.036 0.125 0.273 0.503 1.000 2010 0.000 0.033 0.118 0.264 0.498 1.000 Values of Lorenz function in the US in 1980, 1990, 2000, and 2010 Part D axb) to the data in Part B and 1. A power model often provides a more accurate fit than a quadratic model for a Lorenz function. Use a calculator or computer to fit a power function (y use it to estimate the Gini index for the United States in 2016. Compare your answer to (2.) and (3.) of Part B. Part B The following table (derived from data supplied by the US Census Bureau) shows values of the Lorenz function for income distribution in the United States for the year 2016. 2 0.0 0.2 0.4 0.6 0.8 1.0 L(2) 0.000 0.031 0.114 0.256 1.000 0.485 Values of Lorenz function L(x) in the United States (2016) 1. What percentage of the total US income was received by the richest 20% of the population in 2016? 2. Use a calculator or computer to fit a quadratic function to the data in the table. Round your coefficients to six decimal places. Graph the data points and the quadratic function. Is the quadratic model a reasonable fit? 3. Use the quadratic model for the Lorenz function to estimate the Gini index for the United States in 2016. Part C 1. The following table gives values for the Lorenz function in the years 1980, 1990, 2000, and 2010. Use the method of Part B to estimate the Gini index for the United States for those years and compare it with your answer to Part B (3.). Do you notice a trend? 2 0.0 0.2 0.4 0.6 0.8 1.0 1980 0.000 0.042 0.144 0.312 0.559 1.000 1990 0.000 0.038 0.134 0.293 0.533 1.000 2000 0.000 0.036 0.125 0.273 0.503 1.000 2010 0.000 0.033 0.118 0.264 0.498 1.000 Values of Lorenz function in the US in 1980, 1990, 2000, and 2010 Part D axb) to the data in Part B and 1. A power model often provides a more accurate fit than a quadratic model for a Lorenz function. Use a calculator or computer to fit a power function (y use it to estimate the Gini index for the United States in 2016. Compare your answer to (2.) and (3.) of Part B