Part E: Applying One and Two-Variable Statistics For this part of the project, you will revisit the data and graphs you have collected thus far
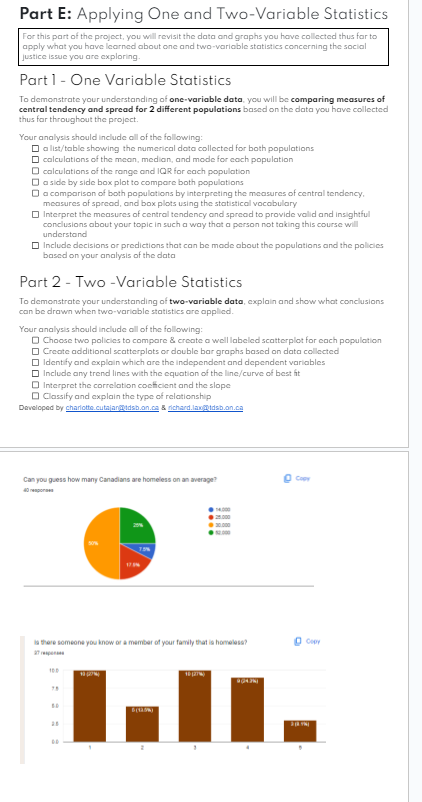
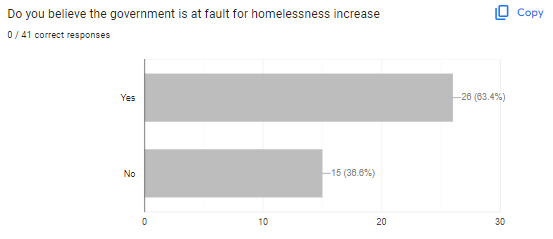
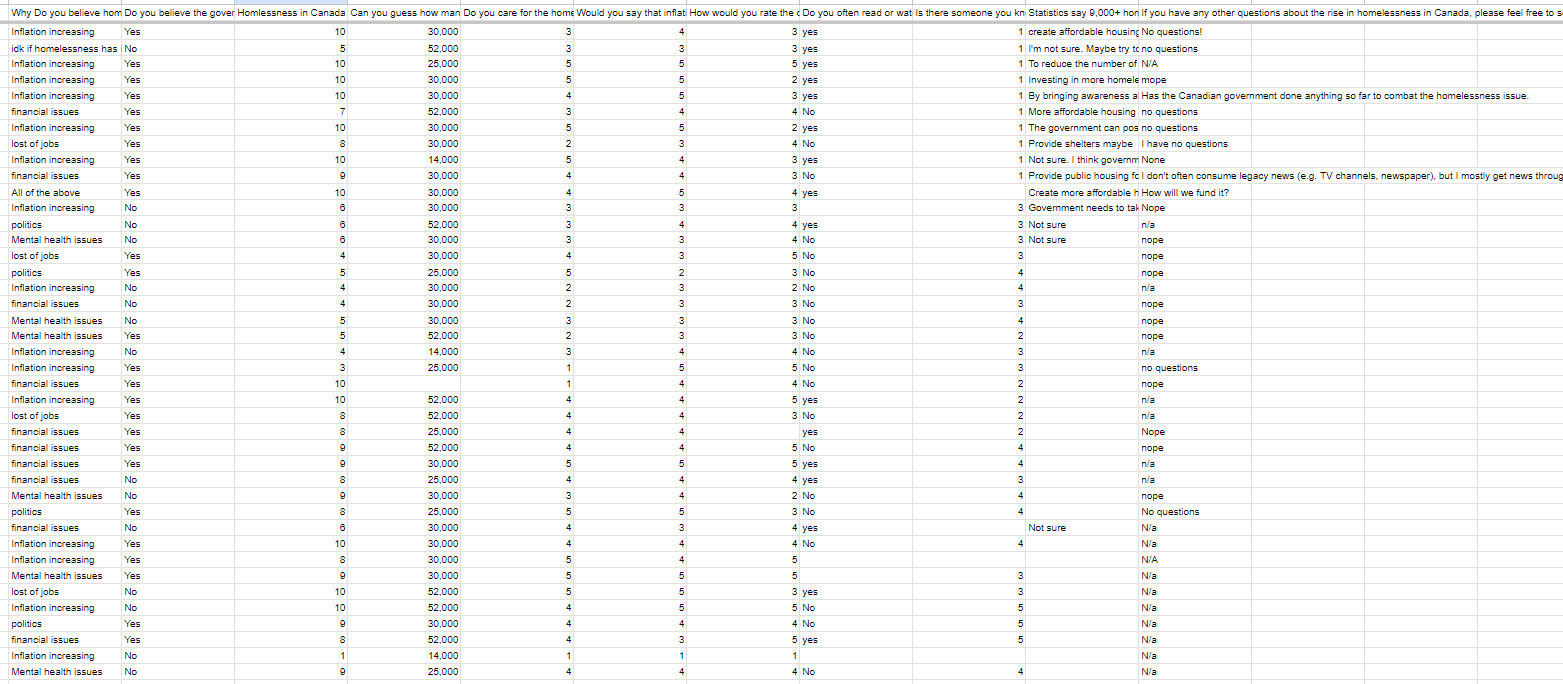
Part E: Applying One and Two-Variable Statistics For this part of the project, you will revisit the data and graphs you have collected thus far to apply what you have learned about one and two-variable statistics concerning the social justice issue you are exploring. Part 1 - One Variable Statistics To demonstrate your understanding of one-variable data, you will be comparing measures of central tendency and spread for 2 different populations based on the data you have collected thus for throughout the project. Your analysis should include all of the following: O a list/table showing the numerical data collected for both populations O calculations of the mean, median, and mode for each population O calculations of the range and IQR for each population O a side by side box plot to compare both populations O a comparison of both populations by interpreting the measures of central tendency, measures of spread, and box plots using the statistical vocabulary I Interpret the measures of central tendency and spread to provide valid and insightful conclusions about your topic in such a way that a person not taking this course will understand O Include decisions or predictions that can be made about the populations and the policies based on your analysis of the data Part 2 - Two -Variable Statistics To demonstrate your understanding of two-variable data, explain and show what conclusions can be drawn when two-variable statistics are applied. Your analysis should include all of the following: O Choose two policies to compare & create a well labeled scatterplot for each population O Create additional scatterplots or double bar graphs based on data collected O Identify and explain which are the independent and dependent variables O Include any trend lines with the equation of the line/curve of best hit O Interpret the correlation coelicient and the slope O Classify and explain the type of relationship Developed by charlotte. cutajanAdsb.on.ca & richard.law@oldsb.on.ca Can you guess how many Canadians are homeless on an average? Copy I thole Someone you know of a member of your family that is homeless? CopyDo you believe the government is at fault for homelessness increase I_D Copy 0,/ 41 correct responses 26 (53.4%) 15 (36.6%) Why Do you believe hom Do you believe the gover Homlessness in Canada Can you guess how man Do you care for the home Would you say that inflat How would you rate the c Do you often read or wat Is there someone you knistatistics say 9,000+ hon If you have any other questions about the rise in homelessness in Canada, please feel free to 3 yes 1 create affordable housing No questions! Inflation increasing Yes 10 30,000 3 yes 1 I'm not sure. Maybe try to no questions idk if homelessness has | No 52,000 1 To reduce the number of N/A Inflation increasing Yes 10 25.000 5 yes 1 Investing in more homele mope Inflation increasing Yes 10 30.000 2 yes 1 By bringing awareness a Has the Canadian government done anything so far to combat the homelessness issue. 10 30,000 3 yes Inflation increasing Yes financial issues Yes 7 52.000 4 No 1 More affordable housing no questions Inflation increasing Yes 10 30.000 2 yes 1 The government can pos no questions 4 No 1 Provide shelters maybe I have no questions lost of jobs Yes 30.000 3 yes 1 Not sure. I think governm None Inflation increasing Yes 10 14,000 1 Provide public housing fo I don't often consume legacy news (e.g. TV channels, newspaper), but I mostly get news throw financial issues Yes 30.000 3 No Yes 30.000 4 yes Create more affordable h How will we fund it? All of the above 3 Government needs to tal Nope Inflation increasing No 30.000 52.000 4 yes 3 Not sure n/a politics No nope Mental health issues No 30.000 4 No 3 Not sure 5 No 3 nope lost of jobs Yes 30,000 nope politics Yes 25.000 3 No 2 No n/a Inflation increasing No 30.000 3 No nope No 30.000 financial issues 30.000 3 No nope Mental health issues No 52.000 3 No nope Mental health issues Yes 14,000 4 No n/a Inflation increasing No 25,000 5 No no questions Inflation increasing Yes 4 No nope Yes f f ( A D N N N N W W N A WA financial issues 52.000 5 yes n/a Inflation increasing Yes lost of jobs 52.000 3 No n/a Yes 25,000 ves Nope financial issues Yes 5 No nope financial issues Yes 52.000 5 yes n/a financial issues Yes 30,000 n/a financial issues No 25.000 4 yes 2 No nope Mental health issues No 30,000 3 No No questions politics Yes 25.000 4 yes Not sure N/a financial issues No 30.000 4 No 4 N/a Inflation increasing Yes 30.000 N/A Inflation increasing Yes 30.000 N/a Mental health issues Yes 30.000 52.000 3 yes N/a lost of jobs No 5 No N/a Inflation increasing No 52.000 30.000 4 No N/a politics Yes 5 yes N/a financial issues Yes 52.000 14,000 1 N/a Inflation increasing No 4 No 4 N/a Mental health issues No 25,000
Step by Step Solution
There are 3 Steps involved in it
Step: 1
Get Instant Access to Expert-Tailored Solutions
See step-by-step solutions with expert insights and AI powered tools for academic success
Step: 2
Step: 3
Ace Your Homework with AI
Get the answers you need in no time with our AI-driven, step-by-step assistance