

Question: Part I. Generate a uniform zero-mean white noise process Generate a 1000 X 50 matrix (1000 rows and 50 columns) representing 1000 sample realizations of
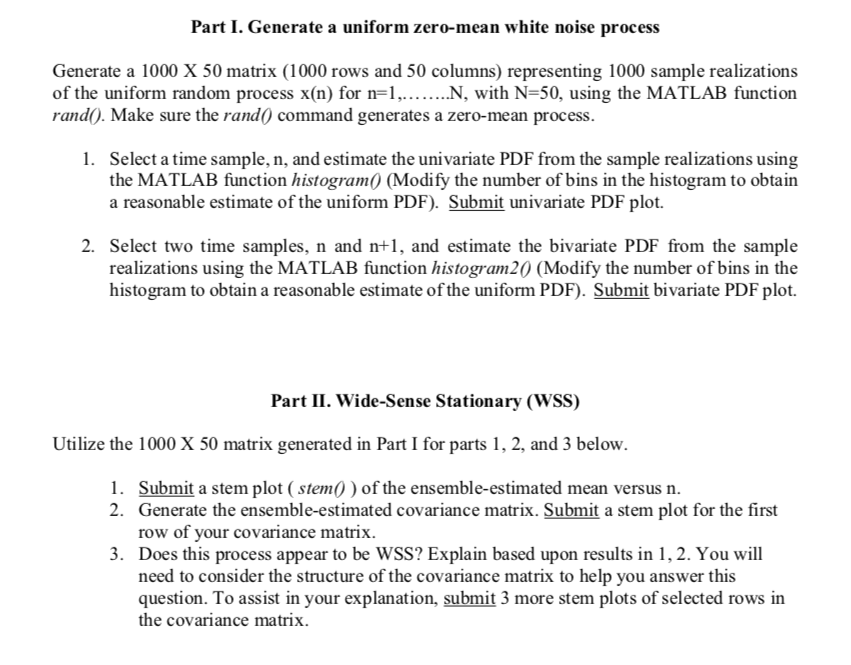
Part I. Generate a uniform zero-mean white noise process Generate a 1000 X 50 matrix (1000 rows and 50 columns) representing 1000 sample realizations of the uniform random process x(n) for n=1, N, with N-50, using the MATLAB function randO. Make sure the rand0 command generates a zero-mean process. 1. Select a time sample, n, and estimate the univariate PDF from the sample realizations using the MATLAB function histogram) (Modify the number of bins in the histogram to obtairn a reasonable estimate of the uniform PDF). Submit univariate PDF plot. 2. Select two time samples, n and n+1, and estimate the bivariate PDF from the sample realizations using the MATLAB function histogram20 (Modify the number of bins in the histogram to obtain a reasonable estimate of the uniform PDF). Submit bivariate PDF plot. Part II. Wide-Sense Stationary (WSS) Utilize the 1000 X 50 matrix generated in Part I for parts 1, 2, and 3 below Submit a stem plot (stem)) of the ensemble-estimated mean versus n. Generate the ensemble-estimated covariance matrix. Submit a stem plot for the first row of your covariance matrix. Does this process appear to be WSS? Explain based upon results in 1, 2. You will need to consider the structure of the covariance matrix to help you answer this question. To assist in your explanation, submit 3 more stem plots of selected rows in the covariance matrix. 1. 2. 3. Part I. Generate a uniform zero-mean white noise process Generate a 1000 X 50 matrix (1000 rows and 50 columns) representing 1000 sample realizations of the uniform random process x(n) for n=1, N, with N-50, using the MATLAB function randO. Make sure the rand0 command generates a zero-mean process. 1. Select a time sample, n, and estimate the univariate PDF from the sample realizations using the MATLAB function histogram) (Modify the number of bins in the histogram to obtairn a reasonable estimate of the uniform PDF). Submit univariate PDF plot. 2. Select two time samples, n and n+1, and estimate the bivariate PDF from the sample realizations using the MATLAB function histogram20 (Modify the number of bins in the histogram to obtain a reasonable estimate of the uniform PDF). Submit bivariate PDF plot. Part II. Wide-Sense Stationary (WSS) Utilize the 1000 X 50 matrix generated in Part I for parts 1, 2, and 3 below Submit a stem plot (stem)) of the ensemble-estimated mean versus n. Generate the ensemble-estimated covariance matrix. Submit a stem plot for the first row of your covariance matrix. Does this process appear to be WSS? Explain based upon results in 1, 2. You will need to consider the structure of the covariance matrix to help you answer this question. To assist in your explanation, submit 3 more stem plots of selected rows in the covariance matrix. 1. 2. 3
Step by Step Solution
There are 3 Steps involved in it

Get step-by-step solutions from verified subject matter experts