

Answered step by step
Verified Expert Solution
Question
1 Approved Answer
PART I You own a T-shirt company that has done so well that the class has decided to expand its operations. You plan to
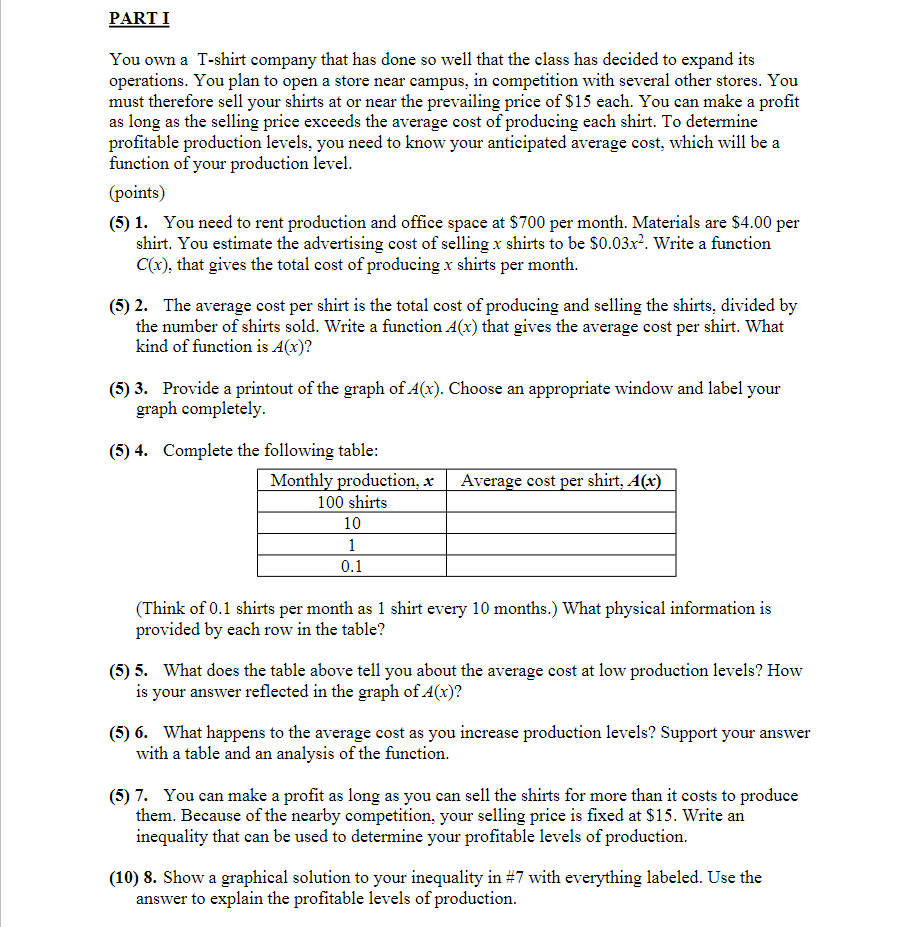
PART I You own a T-shirt company that has done so well that the class has decided to expand its operations. You plan to open a store near campus, in competition with several other stores. You must therefore sell your shirts at or near the prevailing price of $15 each. You can make a profit as long as the selling price exceeds the average cost of producing each shirt. To determine profitable production levels, you need to know your anticipated average cost, which will be a function of your production level. (points) (5) 1. You need to rent production and office space at $700 per month. Materials are $4.00 per shirt. You estimate the advertising cost of selling x shirts to be $0.03x. Write a function C(x), that gives the total cost of producing x shirts per month. (5) 2. The average cost per shirt is the total cost of producing and selling the shirts, divided by the number of shirts sold. Write a function A(x) that gives the average cost per shirt. What kind of function is A(x)? (5) 3. Provide a printout of the graph of A(x). Choose an appropriate window and label your graph completely. (5) 4. Complete the following table: Monthly production, x Average cost per shirt, A(x) 100 shirts 10 1 0.1 (Think of 0.1 shirts per month as 1 shirt every 10 months.) What physical information is provided by each row in the table? (5) 5. What does the table above tell you about the average cost at low production levels? How is your answer reflected in the graph of A(x)? (5) 6. What happens to the average cost as you increase production levels? Support your answer with a table and an analysis of the function. (5) 7. You can make a profit as long as you can sell the shirts for more than it costs to produce them. Because of the nearby competition, your selling price is fixed at $15. Write an inequality that can be used to determine your profitable levels of production. (10) 8. Show a graphical solution to your inequality in #7 with everything labeled. Use the answer to explain the profitable levels of production.
Step by Step Solution
There are 3 Steps involved in it
Step: 1
Sol...
Get Instant Access to Expert-Tailored Solutions
See step-by-step solutions with expert insights and AI powered tools for academic success
Step: 2

Step: 3
Ace Your Homework with AI
Get the answers you need in no time with our AI-driven, step-by-step assistance
Get Started
Transportation A Global Supply Chain Perspective
Authors: John J. Coyle, Robert A. Novak, Brian Gibson, Edward J. Bard
8th edition
9781305445352, 1133592961, 130544535X, 978-1133592969