

Question
Part II.1 - Toyota's Hybrid Drive Systems As of late 2019, Toyota Motor Corporation has twelve engineering and manufacturing facilities in the United States. Recently,
Part II.1 - Toyota's Hybrid Drive Systems
As of late 2019, Toyota Motor Corporation has twelve engineering and manufacturing facilities in the United States. Recently, Toyota has been considering expanding the production of their gas- electric hybrid drive systems in the U.S. To enable the expansion, they are contemplating investing $1.5 billion at the end of 2021 (Year 0) in a new plant with an expected 10-year life. In the meantime, they also need to invest $30 million upfront in net working capital before the production can take place.
The projected financials of the new project for the Year 1 operation (2022) are as follows:
Earnings before interest and taxes (EBIT): Depreciation expense: Increase in net working capital:
$170 million $150 million $40 million
The anticipated unlevered free cash flows from the new plant will grow by 5% for each of the next two years (Years 2 and 3) and then 2% per year for the remaining seven years. As a newly hired MBA in the capital budgeting division, you have been asked to evaluate the new project using the WACC method. You will estimate the cash flows and compute the appropriate cost of capital and the net present values. Assume that Toyota's corporate tax rate is 21%.
Question: In the sheet "Toyota's cost of capital", estimate the project's unlevered free cash flows from Year 0 to Year 10 (or equivalently from Year 2021 to 2031, the end year of the project). **Please show excel formulas as well.**
This is what I have so far
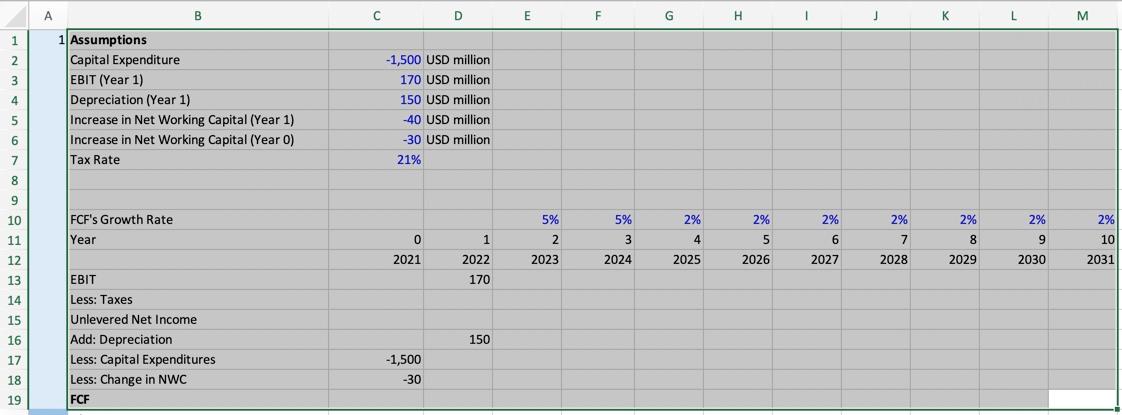
B D E F G H 1 J L M 1 Assumptions Capital Expenditure EBIT (Year 1) Depreciation (Year 1) Increase in Net Working Capital (Year 1) Increase in Net Working Capital (Year 0) Tax Rate -1,500 USD million 170 USD million 150 USD million -40 USD million -30 USD million 21% GBBB vom WN 5% 5% 2% 2% 2% 2% 2% 2% FCF's Growth Rate Year 0 2 3 4 8 9 2% 7 2028 1 2022 10 5 2026 6 2027 2021 2023 2024 2025 2029 2030 2031 170 EBIT Less: Taxes Unlevered Net Income Add: Depreciation Less: Capital Expenditures Less: Change in NWC FCF 150 17 -1,500 -30 B D E F G H 1 J L M 1 Assumptions Capital Expenditure EBIT (Year 1) Depreciation (Year 1) Increase in Net Working Capital (Year 1) Increase in Net Working Capital (Year 0) Tax Rate -1,500 USD million 170 USD million 150 USD million -40 USD million -30 USD million 21% GBBB vom WN 5% 5% 2% 2% 2% 2% 2% 2% FCF's Growth Rate Year 0 2 3 4 8 9 2% 7 2028 1 2022 10 5 2026 6 2027 2021 2023 2024 2025 2029 2030 2031 170 EBIT Less: Taxes Unlevered Net Income Add: Depreciation Less: Capital Expenditures Less: Change in NWC FCF 150 17 -1,500 -30
Step by Step Solution
There are 3 Steps involved in it
Step: 1

Get Instant Access to Expert-Tailored Solutions
See step-by-step solutions with expert insights and AI powered tools for academic success
Step: 2

Step: 3
Ace Your Homework with AI
Get the answers you need in no time with our AI-driven, step-by-step assistance
Get Started
Finance A Quantitative Introduction Volume 2
Authors: Piotr Staszkiewicz, Lucia Staszkiewicz
1st Edition
0128027975, 978-0128027974