Answered step by step
Verified Expert Solution
Question
1 Approved Answer
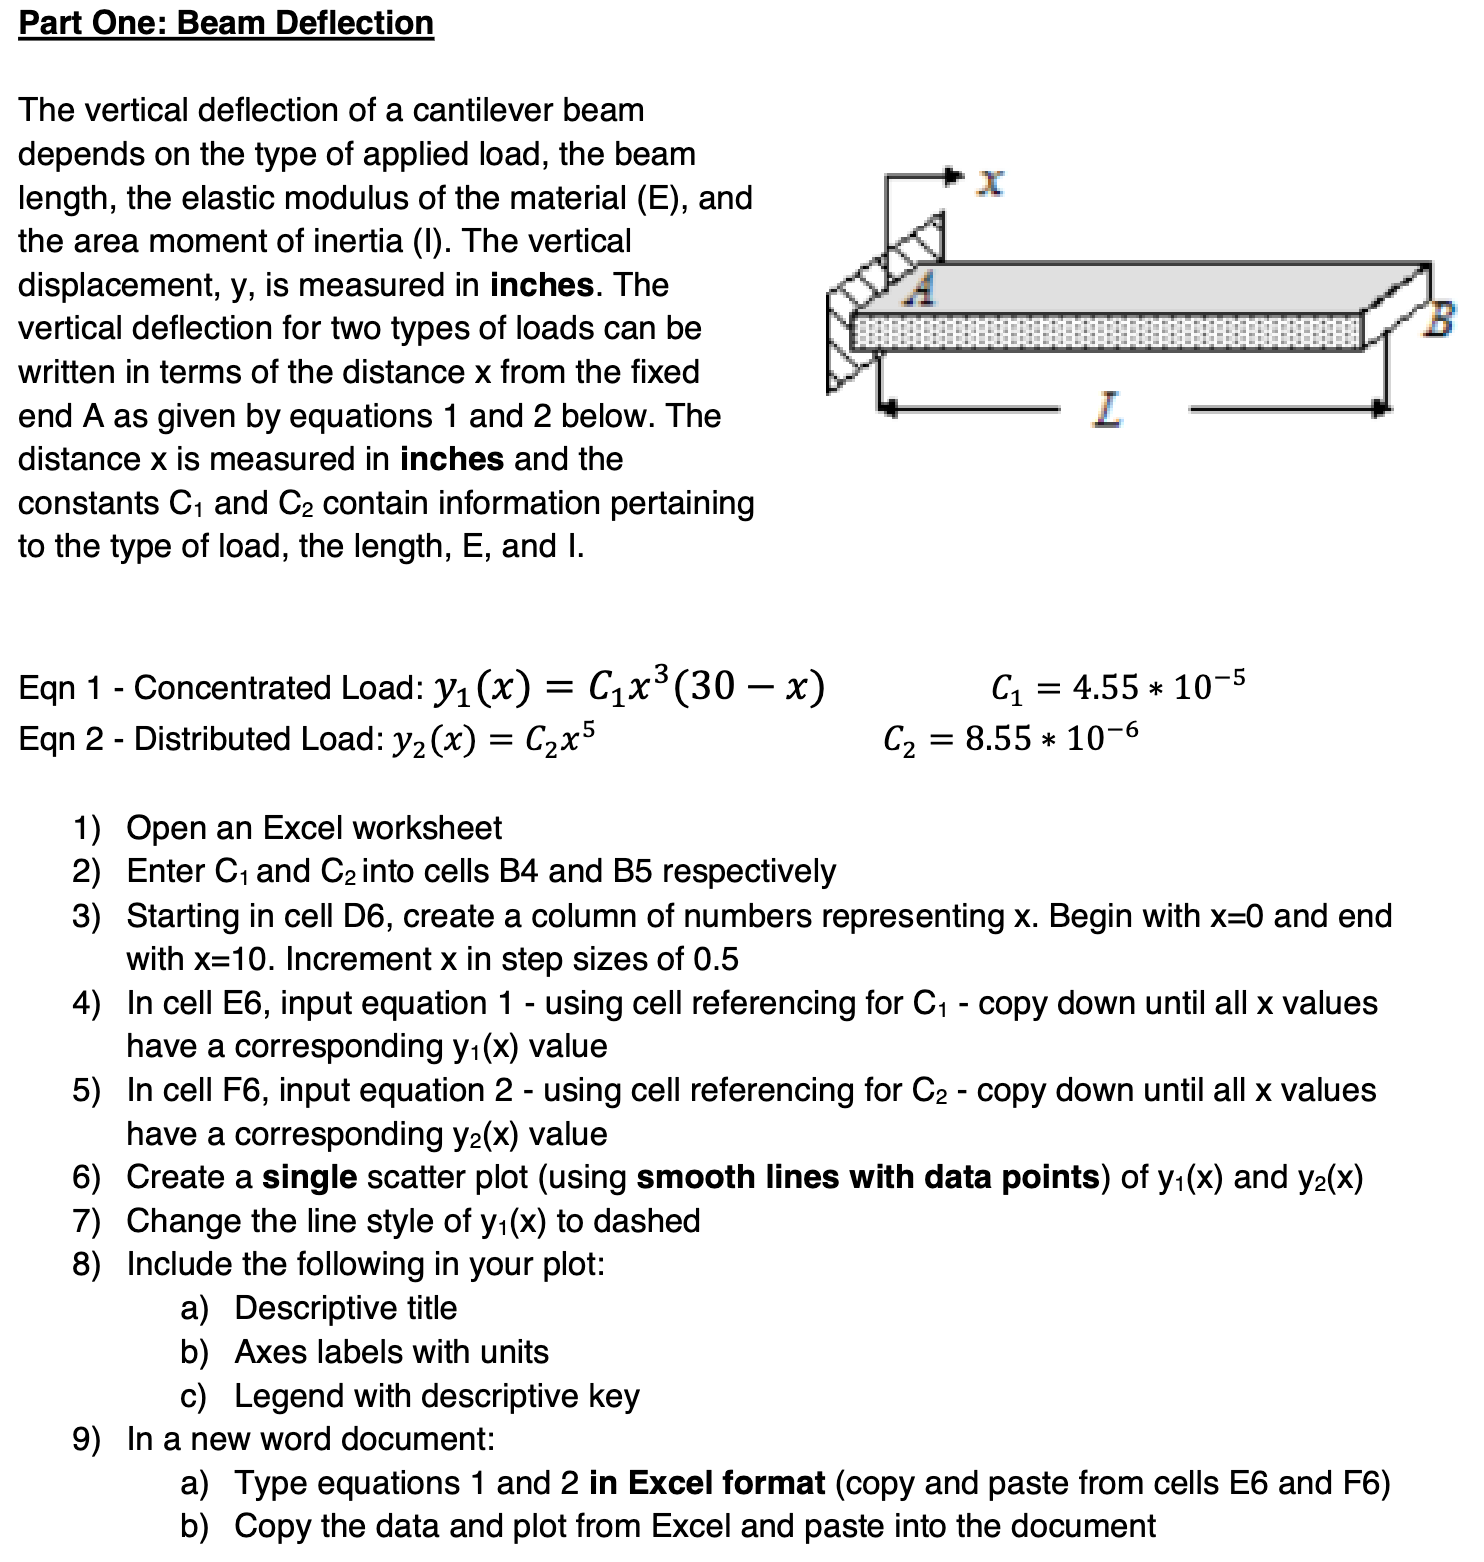
Part One: Beam Deflection The vertical deflection of a cantilever beam depends on the type of applied load, the beam length, the elastic modulus


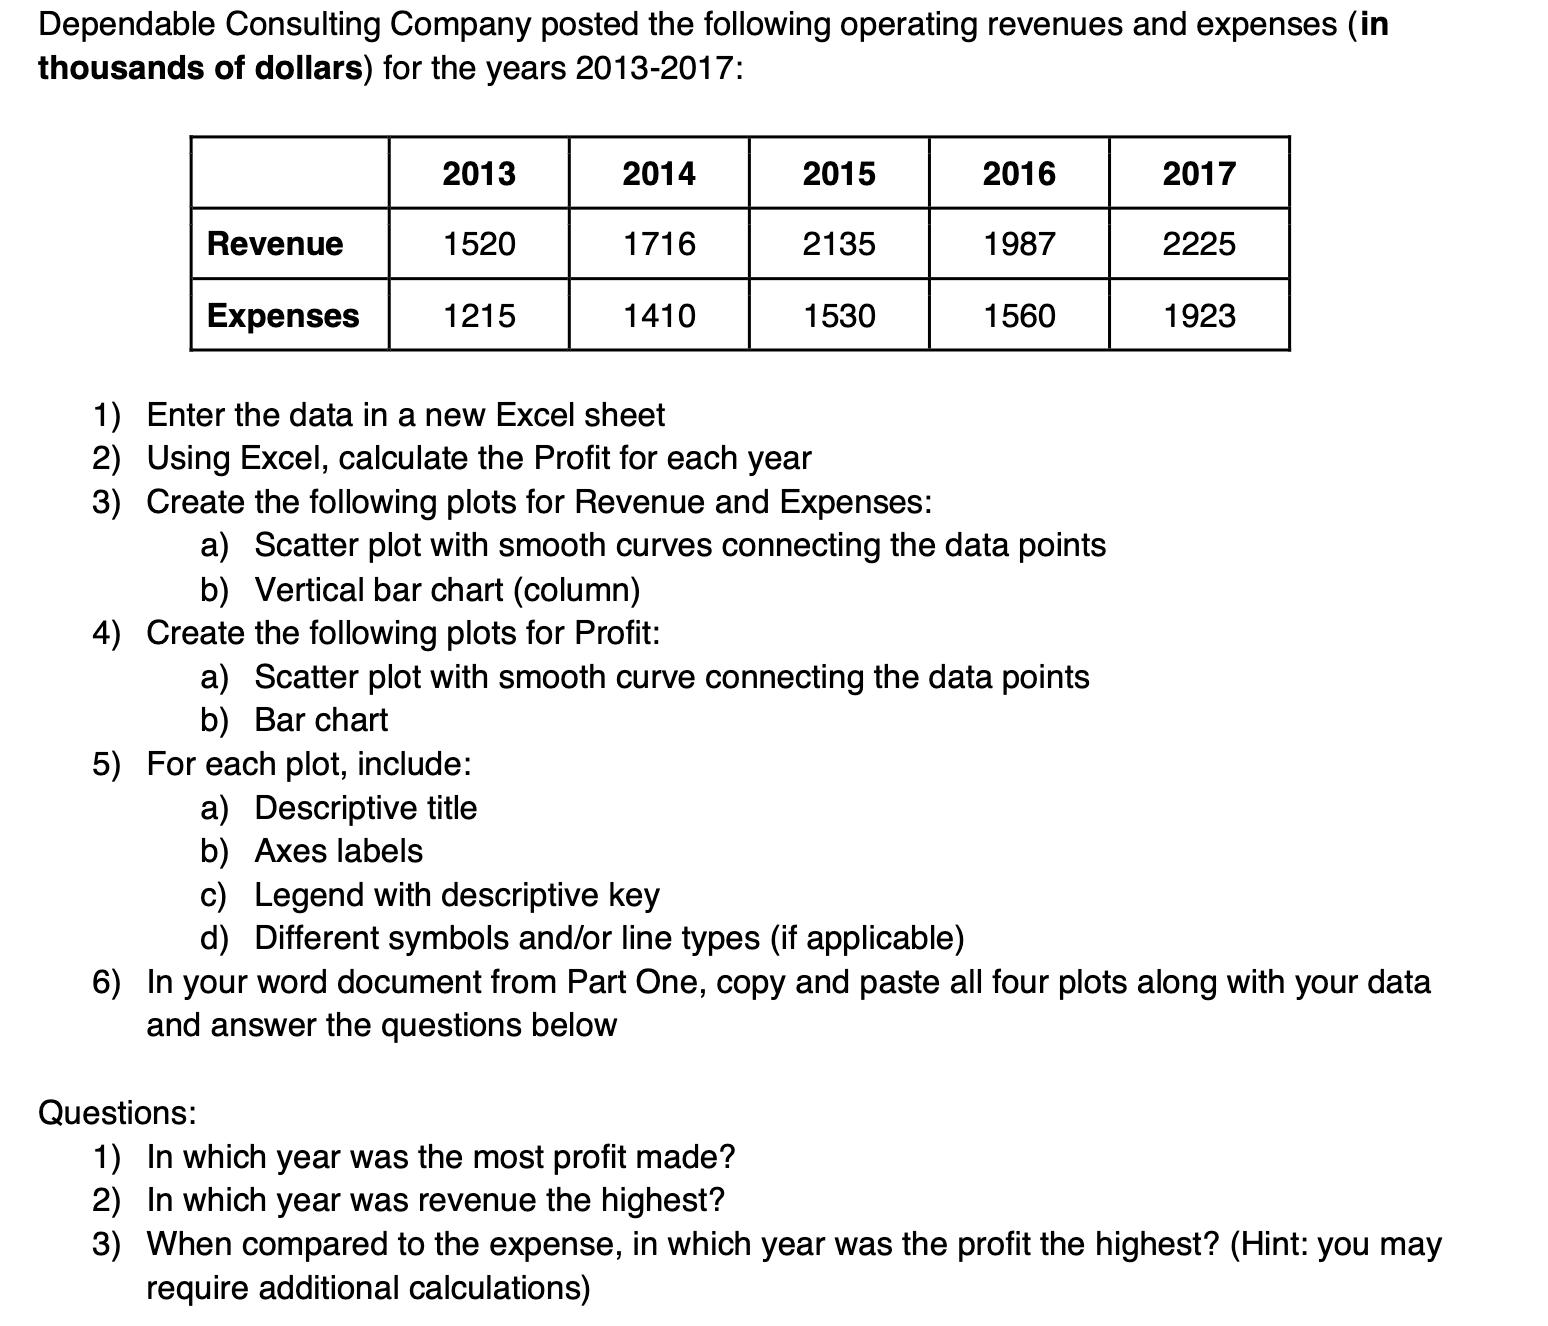
Part One: Beam Deflection The vertical deflection of a cantilever beam depends on the type of applied load, the beam length, the elastic modulus of the material (E), and the area moment of inertia (I). The vertical displacement, y, is measured in inches. The vertical deflection for two types of loads can be written in terms of the distance x from the fixed end A as given by equations 1 and 2 below. The distance x is measured in inches and the constants C and C2 contain information pertaining to the type of load, the length, E, and I. Eqn 1 - Concentrated Load: y (x) = Cx (30 - x) Eqn 2 - Distributed Load: y2(x) = C2x5 1) Open an Excel worksheet I C = 4.55 10-5 C2 = 8.55 * 10-6 2) Enter C and C2 into cells B4 and B5 respectively 3) Starting in cell D6, create a column of numbers representing x. Begin with x=0 and end with x=10. Increment x in step sizes of 0.5 4) In cell E6, input equation 1 - using cell referencing for C - copy down until all x values have a corresponding y(x) value 5) In cell F6, input equation 2 - using cell referencing for C2 - copy down until all x values have a corresponding y(x) value 6) Create a single scatter plot (using smooth lines with data points) of y(x) and y2(x) 7) Change the line style of y(x) to dashed 8) Include the following in your plot: a) Descriptive title b) Axes labels with units c) Legend with descriptive key 9) In a new word document: a) Type equations 1 and 2 in Excel format (copy and paste from cells E6 and F6) b) Copy the data and plot from Excel and paste into the document Dependable Consulting Company posted the following operating revenues and expenses (in thousands of dollars) for the years 2013-2017: Revenue Expenses 2013 1520 1215 2014 1716 1410 5) For each plot, include: a) Descriptive title b) Axes labels 2015 2135 1) Enter the data in a new Excel sheet 2) Using Excel, calculate the Profit for each year 3) Create the following plots for Revenue and Expenses: 4) Create the following plots for Profit: 1530 2016 1987 a) Scatter plot with smooth curves connecting the data points b) Vertical bar chart (column) 1560 a) Scatter plot with smooth curve connecting the data points b) Bar chart 2017 2225 1923 c) Legend with descriptive key d) Different symbols and/or line types (if applicable) 6) In your word document from Part One, copy and paste all four plots along with your data and answer the questions below Questions: 1) In which year was the most profit made? 2) In which year was revenue the highest? 3) When compared to the expense, in which year was the profit the highest? (Hint: you may require additional calculations)
Step by Step Solution
There are 3 Steps involved in it
Step: 1

Get Instant Access to Expert-Tailored Solutions
See step-by-step solutions with expert insights and AI powered tools for academic success
Step: 2

Step: 3

Ace Your Homework with AI
Get the answers you need in no time with our AI-driven, step-by-step assistance
Get Started


