Answered step by step
Verified Expert Solution
Link Copied!

Question

1 Approved Answer

Part One: Excel Data Analysis For the first part of the project you will analyze a few key performance characteristics of this toy company. This

image text in transcribed
Part One: Excel Data Analysis For the first part of the project you will analyze a few key performance characteristics of this toy company. This toy company does business internationally and it is interesting to look at where the company does business. It is also interesting to observe the types of products that are popular amongst each country. Consider how you might further develop the markets that seem promising in your analysis. You are welcome to make more pivots than suggested below if you would like to do a deeper analysis. First click anywhere on the data and click on "Insert PivotTable". Add a new PivotTable for each part so you don't lose your work. In total you will need six tabs-one for the data and five for each of the five pivots/charts you will create. Next please create the following PivotTables and insert PivotCharts as requested: 1) Find the total count of orders in each territory. Then add an additional row below the territory to find the breakdown among each country. 2) Create a pivot that filters the country to only United States. Create a bar graph that shows the distribution of sales across each state. 3) Create a pie-chart that shoes the percentage of orders for each productline item listed in the data. 4) Create a line-graph that indicates the total sales per quarter over 2003, 2004, and 2005 (*hint add the orderdate column to your pivot and it will populate years and quarters automatically). 5) Create a histogram that shows the distribution of sales across all orders

Step by Step Solution

There are 3 Steps involved in it

Step: 1

blur-text-image

Get Instant Access to Expert-Tailored Solutions

See step-by-step solutions with expert insights and AI powered tools for academic success

Step: 2

blur-text-image

Step: 3

blur-text-image

Ace Your Homework with AI

Get the answers you need in no time with our AI-driven, step-by-step assistance

Get Started

Recommended Textbook for

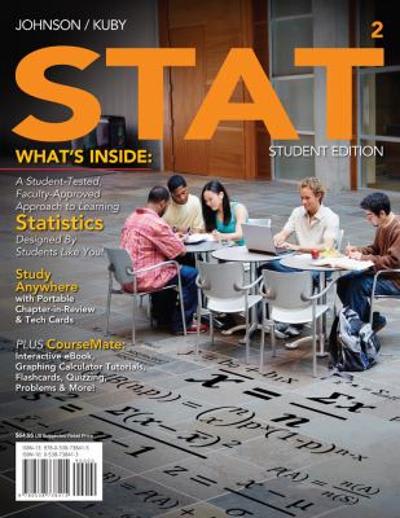
STAT 2

Authors: Robert R Johnson, Patricia J Kuby

2nd Edition

1133169953, 9781133169956

More Books

Students also viewed these Mathematics questions

Question

Mortality rate

Answered: 1 week ago

Question

Armed conflicts.

Answered: 1 week ago