

Question
Part One: Using the data for Life Expectancy in theStatistics for 42 Countries(you can use the link to the Google Sheet below to obtain the

Part One:
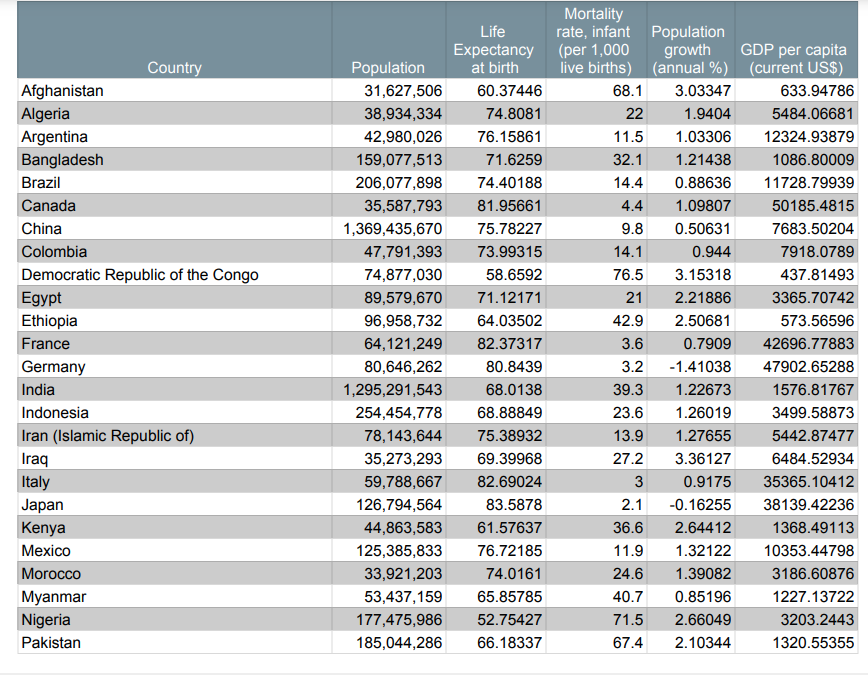
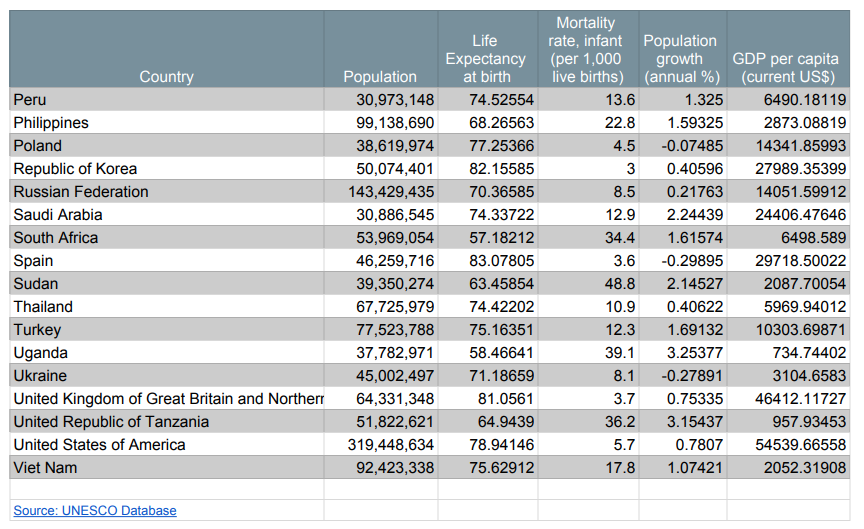
- Using the data for Life Expectancy in theStatistics for 42 Countries(you can use the link to the Google Sheet below to obtain the data required). The mean Life Expectancy is 71.94 and the standard deviation is 7.88. Complete full solutions to the following questions using thez-score chart(show your work): (table is attached below)
(a) Determine the probability that a country has a Life Expectancyless thanthe Russian Life Expectancy.
(b) Determine the probability that a country has a Life Expectancygreater thanthe Life Expectancy of Turkey.
(c) Determine the probability that a country has a Life Expectancybetweenthe Life Expectancy of China andPakistan.
(d) Determine the probability that a country has a Life Expectancyless thanthe United Kingdom.
(e) The actual number of countries with a Life Expectancyless thanthe United Kingdom is 35. Determine theactual percentof countries with a Life Expectancyless thanthe United Kingdom.
(f) Compare your answer to part ii. with i.Explainwhat the difference suggests about the data for Life Expectancy for the 42 countries.
Part two:
- A student asks her teacher "What is the probability that it will take youexactly20 minutes to walk to school in the morning?"What will be the teacher'sreply?What is a better question to ask? Explain by referring to concepts that we discussed in this unit.
2.Describe how calculating probability for continuous random variables is different than calculating probability for discrete random variables.Explain using examples discussed in the activity and ideas discussed in this unit.
3.The heights of players in Major League Baseball are normally distributed and have a minimum of 5.5 feet and maximum of 6.83 feet.Someone in our class explains that the standard deviation must be less than of the difference between the max and the min.To what extent do you agree?Totally agree, somewhat agree, disagree. Defend your decision by including a sketch of a normal curve and referring to properties of the normally distributed data discussed in this unit.
4.The length of time of full-length movies is approximately normally distributed with a mean of 1.9 hours and standard deviation of 0.3 hours.Based on this scenario, explain what a Z-Score is.
5.Describe how you could use the normal distribution to describe how a manufacturing company decides whether or not a part is defective.Give specific examples with numbers and explanations.You may research some examples on the internet.
6.The time it takes to drive from Orangeville to the Vaughan Mills Mall is normally distributed with a mean of 52 minutes and standard deviation of 5 minutes.Based on what you have learned about the Normal Distribution Curve, there are intervals that you could you estimate without using the Z-score table and that do not include the mean as a max or min.For example,is an interval we know that includes the mean as the maximum of the interval. Another example isas an example of a probability interval that includes the mean as the minimum and 57 as the maximum.Includeat least 6 intervals,their probabilities and a sketchfor each in your answer.
Step by Step Solution
There are 3 Steps involved in it
Step: 1

Get Instant Access to Expert-Tailored Solutions
See step-by-step solutions with expert insights and AI powered tools for academic success
Step: 2

Step: 3
Ace Your Homework with AI
Get the answers you need in no time with our AI-driven, step-by-step assistance
Get Started
Partial Differential Equations For Scientists And Engineers
Authors: Stanley J Farlow
1st Edition
0486134733, 9780486134734