

Answered step by step
Verified Expert Solution
Question
1 Approved Answer
Part VI, last chart. Question: If the mean for prediastolic is 87.231 and contr.sum was used in R, what is the emmean for diet 2?
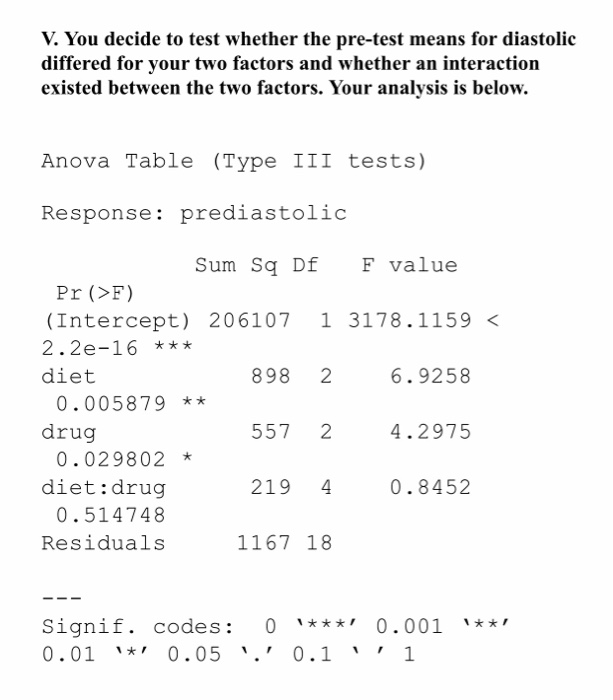
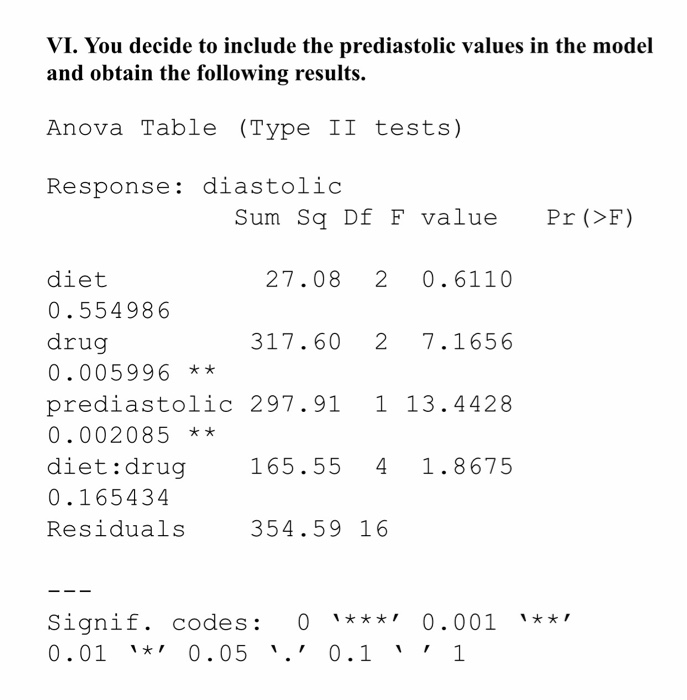
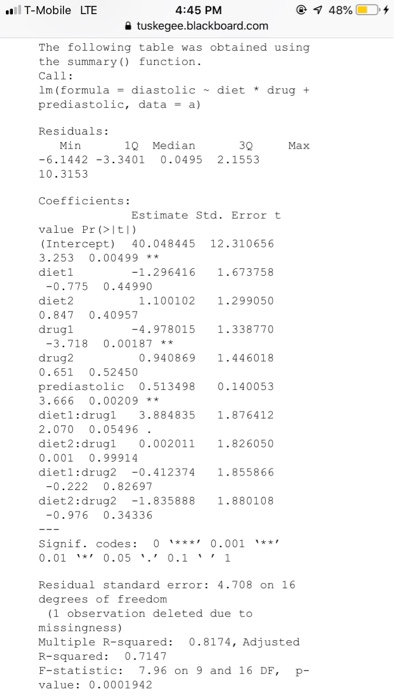
Part VI, last chart.
Question: If the mean for prediastolic is 87.231 and contr.sum was used in R, what is the emmean for diet 2?
I have included all the previous pages for your reference. Thank you.
Step by Step Solution
There are 3 Steps involved in it
Step: 1

Get Instant Access to Expert-Tailored Solutions
See step-by-step solutions with expert insights and AI powered tools for academic success
Step: 2

Step: 3
Ace Your Homework with AI
Get the answers you need in no time with our AI-driven, step-by-step assistance
Get Started
Sql Data Analytics Made Easy Your Step By Step Guide To Unlocking Datas Hidden Secrets Demystify Complex Concepts And Harness The Power Of Data To Drive Intelligent Decision Making Effortlessly
Authors: L D Knowings
1st Edition
B0CKHWZ35K, 979-8862830880