

Answered step by step
Verified Expert Solution
Question
1 Approved Answer
part3 what does the CAPM allow you to calculate. does it imply that a stock with a beta of zero will offer a zero expected
part3 what does the CAPM allow you to calculate. does it imply that a stock with a beta of zero will offer a zero expected rate of return .why
all part to be solved
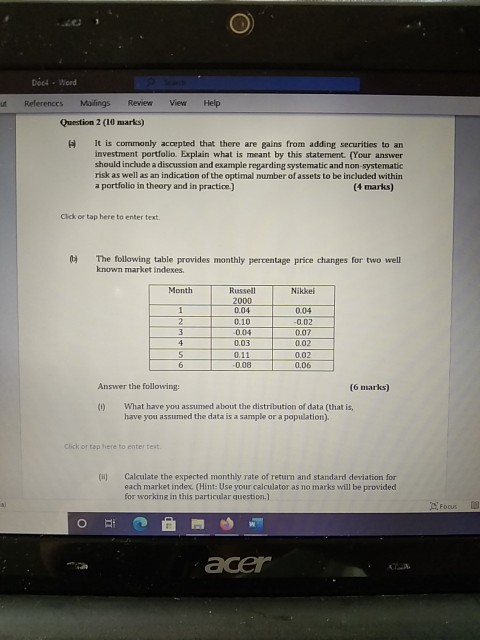
Doce - Word ut View Help References Mailings Review Question 2 (10 marks) It is commonly accepted that there are gains from adding securities to an investment portfolio. Explain what is meant by this statement. (Your answer should include a discussion and example regarding systematic and non-systematic risk as well as an indication of the optimal number of assets to be included within a portfolio in theory and in practice.) (4 marks) Click or tap here to enter text. The following table provides monthly percentage price changes for two well known market indexes. Month Nikkei 1 2 3 4. 5 6 Russell 2000 0.04 0.10 -0.04 0.03 0.11 -0.08 0.04 -0.02 0.07 0.02 0.02 0.06 Answer the following: (6 marks) (0) What have you assumed about the distribution of data (that is, have you assumed the data is a sample or a population) Click or tap here to entertext (a Calculate the expected monthly rate of return and standard deviation for each market index. (Hint: Use your calculator as no marks will be provided for working in this particular question.) Focus O BI acer Doce - Word ut View Help References Mailings Review Question 2 (10 marks) It is commonly accepted that there are gains from adding securities to an investment portfolio. Explain what is meant by this statement. (Your answer should include a discussion and example regarding systematic and non-systematic risk as well as an indication of the optimal number of assets to be included within a portfolio in theory and in practice.) (4 marks) Click or tap here to enter text. The following table provides monthly percentage price changes for two well known market indexes. Month Nikkei 1 2 3 4. 5 6 Russell 2000 0.04 0.10 -0.04 0.03 0.11 -0.08 0.04 -0.02 0.07 0.02 0.02 0.06 Answer the following: (6 marks) (0) What have you assumed about the distribution of data (that is, have you assumed the data is a sample or a population) Click or tap here to entertext (a Calculate the expected monthly rate of return and standard deviation for each market index. (Hint: Use your calculator as no marks will be provided for working in this particular question.) Focus O BI acerStep by Step Solution
There are 3 Steps involved in it
Step: 1

Get Instant Access to Expert-Tailored Solutions
See step-by-step solutions with expert insights and AI powered tools for academic success
Step: 2

Step: 3
Ace Your Homework with AI
Get the answers you need in no time with our AI-driven, step-by-step assistance
Get Started
Cost Management Measuring Monitoring And Motivating Performance
Authors: Leslie G. Eldenburg, Susan Wolcott
1st Edition
0471205494, 978-0471205494