parts 1-4
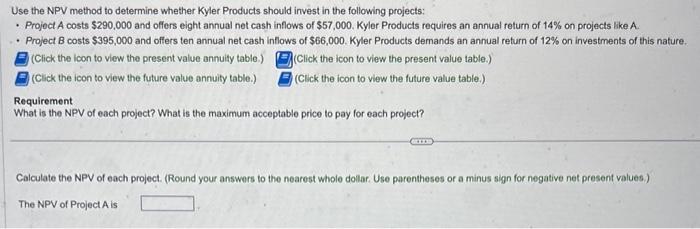
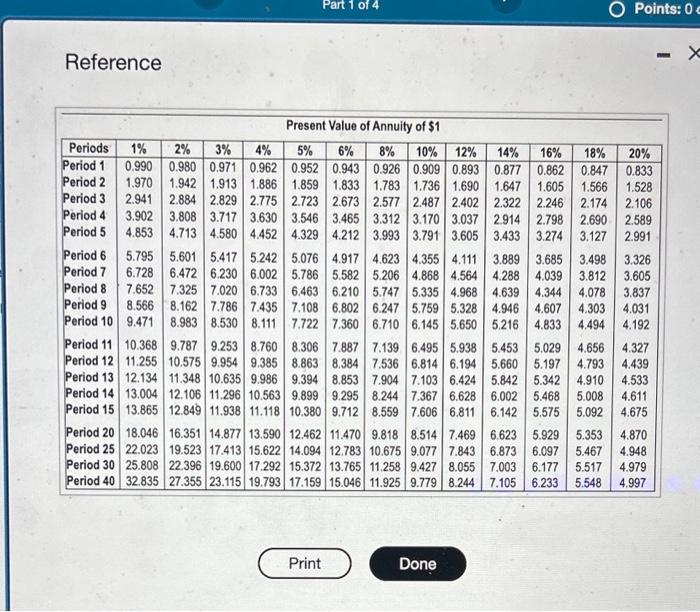
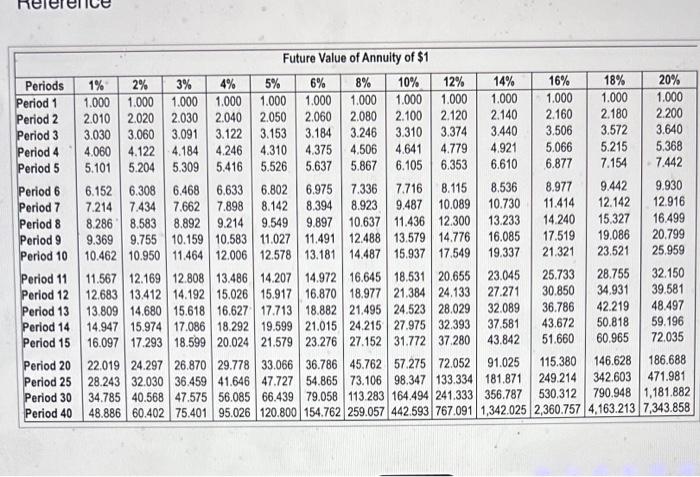
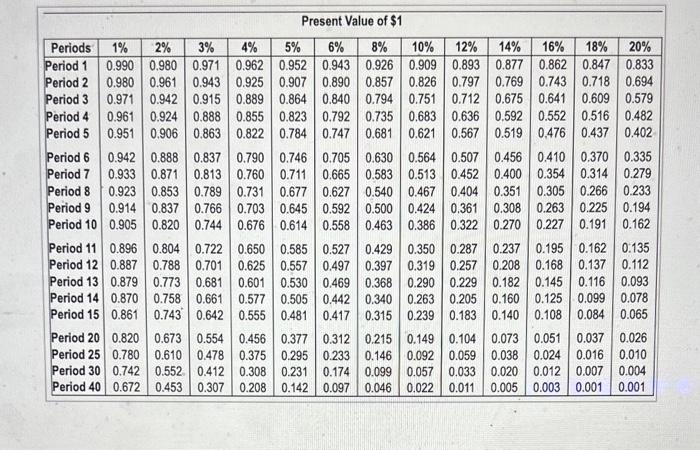
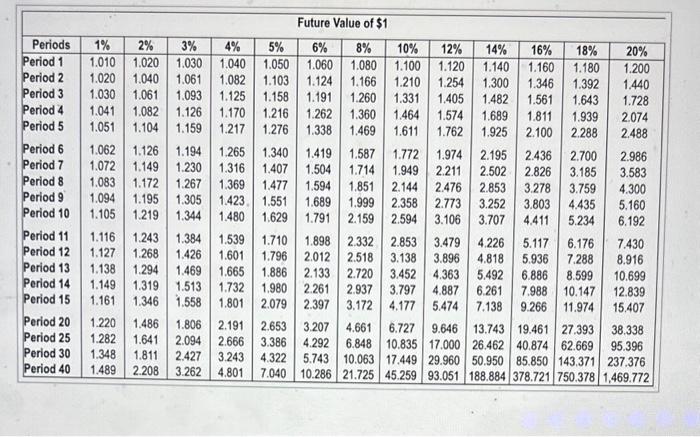
Use the NPV method to determine whether Kyler Products should invest in the following projects: - Project A costs $290,000 and offers eight annual net cash inflows of $57,000. Kyler Products requires an annual return of 14% on projects like A. - Project B costs $395,000 and offers ten annual net cash inflows of $66,000. Kyler Products dernands an annual return of 12% on investments of this nature. (Click the icon to view the present value annuity table.) (Click the icon to view the present value table.) (Cick the icon to view the future value annuity table.) (Cick the icon to view the future value table.) Requirement What is the NPV of each project? What is the maximum acceptable price to pay for each project? Calculate the NPV of each project. (Round your answers to the nearest whole dollar. Use parentheses or a minus sign for negative net present values) The NPV of Project A is Reference Procont Valua nf A nnuitu of eA Fisture Value of Annuitv of $1 Present Value of $1 \begin{tabular}{|l|c|c|c|c|c|c|c|c|c|c|c|c|c|} \hline Periods & 1% & 2% & 3% & 4% & 5% & 6% & 8% & 10% & 12% & 14% & 16% & 18% & 20% \\ \hline Period 1 & 0.990 & 0.980 & 0.971 & 0.962 & 0.952 & 0.943 & 0.926 & 0.909 & 0.893 & 0.877 & 0.862 & 0.847 & 0.833 \\ Period 2 & 0.980 & 0.961 & 0.943 & 0.925 & 0.907 & 0.890 & 0.857 & 0.826 & 0.797 & 0.769 & 0.743 & 0.718 & 0.694 \\ Period 3 & 0.971 & 0.942 & 0.915 & 0.889 & 0.864 & 0.840 & 0.794 & 0.751 & 0.712 & 0.675 & 0.641 & 0.609 & 0.579 \\ Period 4 & 0.961 & 0.924 & 0.888 & 0.855 & 0.823 & 0.792 & 0.735 & 0.683 & 0.636 & 0.592 & 0.552 & 0.516 & 0.482 \\ Period 5 & 0.951 & 0.906 & 0.863 & 0.822 & 0.784 & 0.747 & 0.681 & 0.621 & 0.567 & 0.519 & 0.476 & 0.437 & 0.402 \\ Period 6 & 0.942 & 0.888 & 0.837 & 0.790 & 0.746 & 0.705 & 0.630 & 0.564 & 0.507 & 0.456 & 0.410 & 0.370 & 0.335 \\ Period 7 & 0.933 & 0.871 & 0.813 & 0.760 & 0.711 & 0.665 & 0.583 & 0.513 & 0.452 & 0.400 & 0.354 & 0.314 & 0.279 \\ Period 8 & 0.923 & 0.853 & 0.789 & 0.731 & 0.677 & 0.627 & 0.540 & 0.467 & 0.404 & 0.351 & 0.305 & 0.266 & 0.233 \\ Period 9 & 0.914 & 0.837 & 0.766 & 0.703 & 0.645 & 0.592 & 0.500 & 0.424 & 0.361 & 0.308 & 0.263 & 0.225 & 0.194 \\ Period 10 & 0.905 & 0.820 & 0.744 & 0.676 & 0.614 & 0.558 & 0.463 & 0.386 & 0.322 & 0.270 & 0.227 & 0.191 & 0.162 \\ Period 11 & 0.896 & 0.804 & 0.722 & 0.650 & 0.585 & 0.527 & 0.429 & 0.350 & 0.287 & 0.237 & 0.195 & 0.162 & 0.135 \\ Period 12 & 0.887 & 0.788 & 0.701 & 0.625 & 0.557 & 0.497 & 0.397 & 0.319 & 0.257 & 0.208 & 0.168 & 0.137 & 0.112 \\ Period 13 & 0.879 & 0.773 & 0.681 & 0.601 & 0.530 & 0.469 & 0.368 & 0.290 & 0.229 & 0.182 & 0.145 & 0.116 & 0.093 \\ Period 14 & 0.870 & 0.758 & 0.661 & 0.577 & 0.505 & 0.442 & 0.340 & 0.263 & 0.205 & 0.160 & 0.125 & 0.099 & 0.078 \\ Period 15 & 0.861 & 0.743 & 0.642 & 0.555 & 0.481 & 0.417 & 0.315 & 0.239 & 0.183 & 0.140 & 0.108 & 0.084 & 0.065 \\ Period 20 & 0.820 & 0.673 & 0.554 & 0.456 & 0.377 & 0.312 & 0.215 & 0.149 & 0.104 & 0.073 & 0.051 & 0.037 & 0.026 \\ Period 25 & 0.780 & 0.610 & 0.478 & 0.375 & 0.295 & 0.233 & 0.146 & 0.092 & 0.059 & 0.038 & 0.024 & 0.016 & 0.010 \\ Period 30 & 0.742 & 0.552 & 0.412 & 0.308 & 0.231 & 0.174 & 0.099 & 0.057 & 0.033 & 0.020 & 0.012 & 0.007 & 0.004 \\ Period 40 & 0.672 & 0.453 & 0.307 & 0.208 & 0.142 & 0.097 & 0.046 & 0.022 & 0.011 & 0.005 & 0.003 & 0.001 & 0.001 \\ \hline \end{tabular} Future Value of $1 \begin{tabular}{|l|c|c|c|c|c|c|c|c|c|c|c|c|c|} \hline Periods & 1% & 2% & 3% & 4% & 5% & 6% & 8% & 10% & 12% & 14% & 16% & 18% & 20% \\ \hline Period 1 & 1.010 & 1.020 & 1.030 & 1.040 & 1.050 & 1.060 & 1.080 & 1.100 & 1.120 & 1.140 & 1.160 & 1.180 & 1.200 \\ Period 2 & 1.020 & 1.040 & 1.061 & 1.082 & 1.103 & 1.124 & 1.166 & 1.210 & 1.254 & 1.300 & 1.346 & 1.392 & 1.440 \\ Period 3 & 1.030 & 1.061 & 1.093 & 1.125 & 1.158 & 1.191 & 1.260 & 1.331 & 1.405 & 1.482 & 1.561 & 1.643 & 1.728 \\ Period 4 & 1.041 & 1.082 & 1.126 & 1.170 & 1.216 & 1.262 & 1.360 & 1.464 & 1.574 & 1.689 & 1.811 & 1.939 & 2.074 \\ Period 5 & 1.051 & 1.104 & 1.159 & 1.217 & 1.276 & 1.338 & 1.469 & 1.611 & 1.762 & 1.925 & 2.100 & 2.288 & 2.488 \\ Period 6 & 1.062 & 1.126 & 1.194 & 1.265 & 1.340 & 1.419 & 1.587 & 1.772 & 1.974 & 2.195 & 2.436 & 2.700 & 2.986 \\ Period 7 & 1.072 & 1.149 & 1.230 & 1.316 & 1.407 & 1.504 & 1.714 & 1.949 & 2.211 & 2.502 & 2.826 & 3.185 & 3.583 \\ Period 8 & 1.083 & 1.172 & 1.267 & 1.369 & 1.477 & 1.594 & 1.851 & 2.144 & 2.476 & 2.853 & 3.278 & 3.759 & 4.300 \\ Period 9 & 1.094 & 1.195 & 1.305 & 1.423 & 1.551 & 1.689 & 1.999 & 2.358 & 2.773 & 3.252 & 3.803 & 4.435 & 5.160 \\ Period 10 & 1.105 & 1.219 & 1.344 & 1.480 & 1.629 & 1.791 & 2.159 & 2.594 & 3.106 & 3.707 & 4.411 & 5.234 & 6.192 \\ Period 11 & 1.116 & 1.243 & 1.384 & 1.539 & 1.710 & 1.898 & 2.332 & 2.853 & 3.479 & 4.226 & 5.117 & 6.176 & 7.430 \\ Period 12 & 1.127 & 1.268 & 1.426 & 1.601 & 1.796 & 2.012 & 2.518 & 3.138 & 3.896 & 4.818 & 5.936 & 7.288 & 8.916 \\ Period 13 & 1.138 & 1.294 & 1.469 & 1.665 & 1.886 & 2.133 & 2.720 & 3.452 & 4.363 & 5.492 & 6.886 & 8.599 & 10.699 \\ Period 14 & 1.149 & 1.319 & 1.513 & 1.732 & 1.980 & 2.261 & 2.937 & 3.797 & 4.887 & 6.261 & 7.988 & 10.147 & 12.839 \\ Period 15 & 1.161 & 1.346 & 1.558 & 1.801 & 2.079 & 2.397 & 3.172 & 4.177 & 5.474 & 7.138 & 9.266 & 11.974 & 15.407 \\ Period 20 & 1.220 & 1.486 & 1.806 & 2.191 & 2.653 & 3.207 & 4.661 & 6.727 & 9.646 & 13.743 & 19.461 & 27.393 & 38.338 \\ Period 25 & 1.282 & 1.641 & 2.094 & 2.666 & 3.386 & 4.292 & 6.848 & 10.835 & 17.000 & 26.462 & 40.874 & 62.669 & 95.396 \\ Period 30 & 1.348 & 1.811 & 2.427 & 3.243 & 4.322 & 5.743 & 10.063 & 17.449 & 29.960 & 50.950 & 85.850 & 143.371 & 237.376 \\ Period 40 & 1.489 & 2.208 & 3.262 & 4.801 & 7.040 & 10.286 & 21.725 & 45.259 & 93.051 & 188.884 & 378.721 & 750.378 & 1.469 .772 \\ \hline \end{tabular}