Answered step by step
Verified Expert Solution
Question
1 Approved Answer
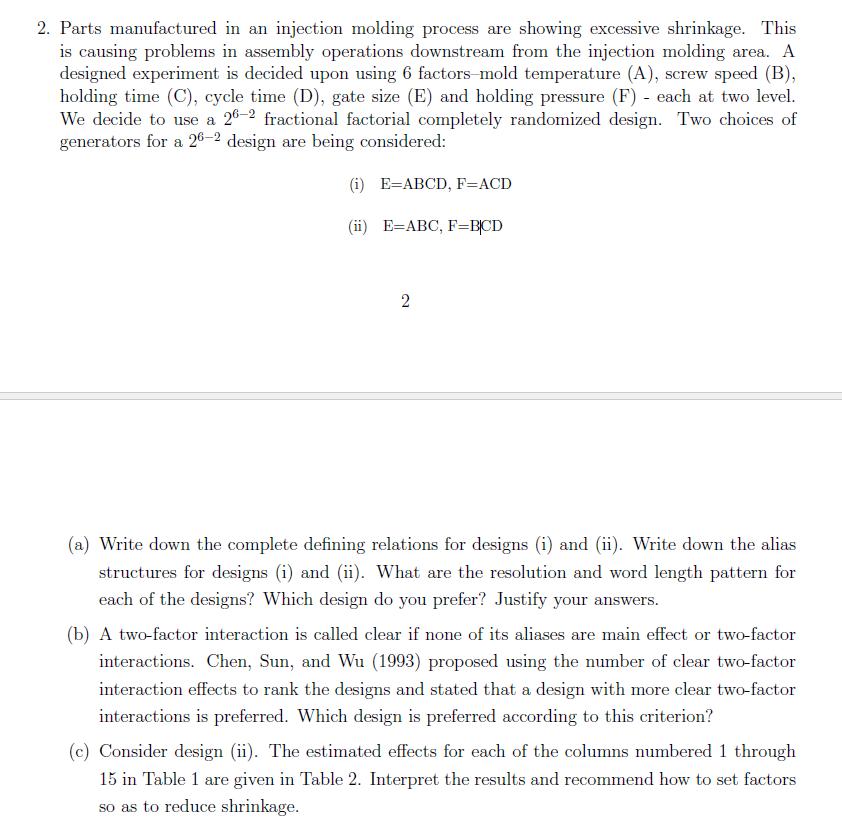
2. Parts manufactured in an injection molding process are showing excessive shrinkage. This is causing problems in assembly operations downstream from the injection molding


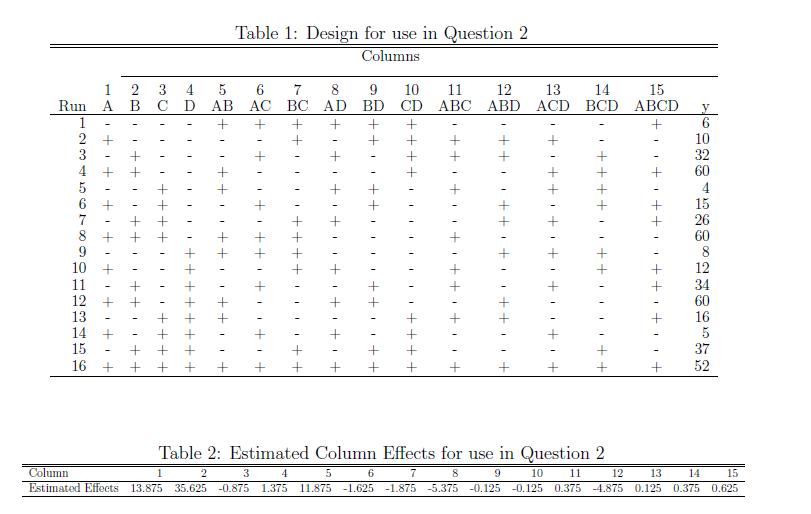
2. Parts manufactured in an injection molding process are showing excessive shrinkage. This is causing problems in assembly operations downstream from the injection molding area. A designed experiment is decided upon using 6 factors mold temperature (A), screw speed (B), holding time (C), cycle time (D), gate size (E) and holding pressure (F) - each at two level. We decide to use a 26-2 fractional factorial completely randomized design. Two choices of generators for a 26-2 design are being considered: (i) E=ABCD, F=ACD (ii) E=ABC, F=B{CD (a) Write down the complete defining relations for designs (i) and (ii). Write down the alias structures for designs (i) and (ii). What are the resolution and word length pattern for each of the designs? Which design do you prefer? Justify your answers. (b) A two-factor interaction is called clear if none of its aliases are main effect or two-factor interactions. Chen, Sun, and Wu (1993) proposed using the number of clear two-factor interaction effects to rank the designs and stated that a design with more clear two-factor interactions is preferred. Which design is preferred according to this criterion? (c) Consider design (ii). The estimated effects for each of the columns numbered 1 through 15 in Table 1 are given in Table 2. Interpret the results and recommend how to set factors so as to reduce shrinkage. 2. Table 1: Design for use in Question 2 Columns 1 2 4 7 8 Run A B CD AB D 9. 10 BD CD 11 12 ABD 13 ACD 14 CD 15 D 1 6 10 32 60 + + 3 4 4 15 26 60 8 12 6 + 10 11 12 13 14 15 34 60 16 37 16 52 Table 2: Estimated Column Effects for use in Question 2 Column 2 3 4 6. 9. 10 11 12 13 14 15 Estimated Effocts 13.875 35.625 -0.875 1.375 11.875 -1.625 -1.875 -5.375 -0.125 -0.125 0.375 -4.875 0.125 0.375 0.625 +++ I ++ IIII++ +i ++ i++ i +i i +i+ ++ + I++ + + + I ++ ++ I + + ++ I+I + + ++ ++++ II i++ ++i III- ++ -+ + - I ++ I ++ I ++ + + + + + + + +
Step by Step Solution
★★★★★
3.33 Rating (153 Votes )
There are 3 Steps involved in it
Step: 1
The ANOVA table is Analysis of Variance Source DF Adj SS Adj MS FValue PValue A 1 75325 75325 846 0017 B 1 500018 500018 5616 0 C 1 325 325 004 0853 D ...
Get Instant Access to Expert-Tailored Solutions
See step-by-step solutions with expert insights and AI powered tools for academic success
Step: 2

Step: 3

Ace Your Homework with AI
Get the answers you need in no time with our AI-driven, step-by-step assistance
Get Started


