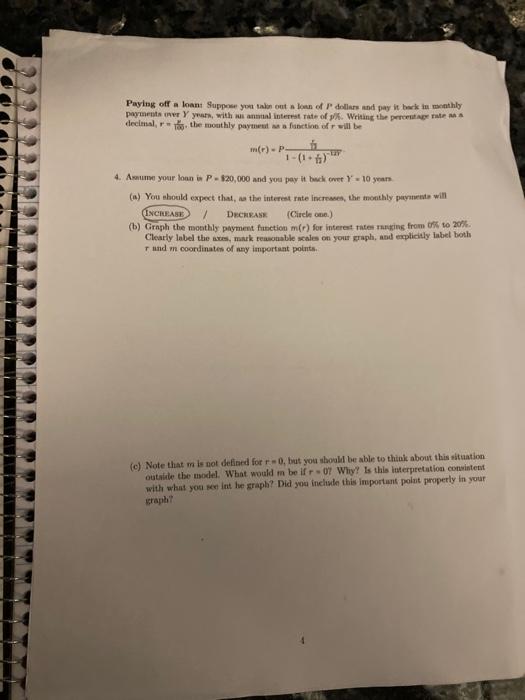
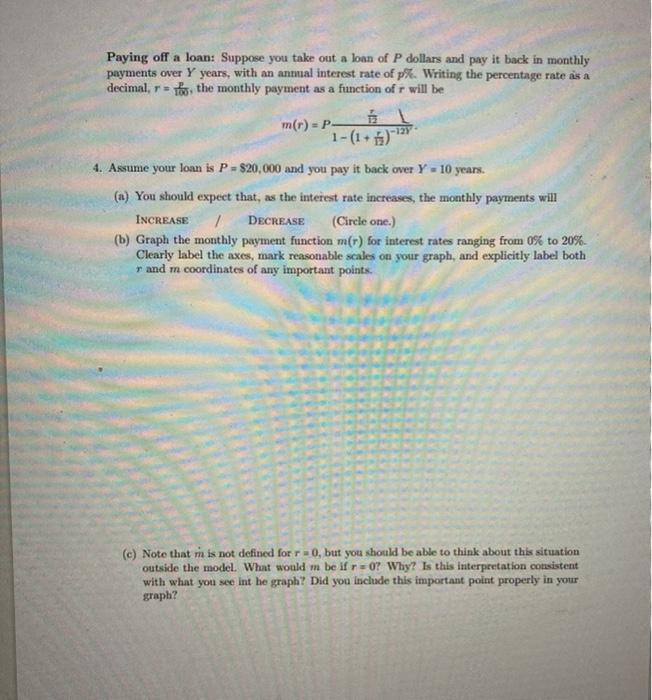
Paying off a loan Suppower your talen ontloan of dollars and pay it back in thly payment Y years, with an interest rate of y. Writing the proper decimal, the monthly payment is a functie of will be m()-P UT 4. Am your loan iP - $20,000 and you pay it back over Y 10 years (a) You should expect that, as the interest rate increases, the monthly payment will (INCREASE 2 DECREASE (Circle one.) (6) Graph the monthly payment function (r) for interest rates ranging from 0 to 20% Clearly label the mark reabile scales on your graph, and explicitly inbel both Tand coordinates of any important points. (c) Note that is not defined for 0, but you should be able to think about this situation outside the model. What would mbeif-07 Why? Is this interpretation consistent with what you see int he graph? Did you include this important polnt properly in your raphy Paying off a loan: Suppose you take out a loan of P dollars and pay it back in monthly payments over Y years, with an antial interest rate of p%. Writing the percentage rate as a decimal, to the monthly payment as a function of r will be m(r) =P B 1-(1.2) 4. Assume your loan is P = $20,000 and you pay it back over Y - 10 years. (a) You should expect that, as the interest rate increases, the monthly payments will INCREASE 7 DECREASE (Circle one.) (b) Graph the monthly payment function m(r) for interest rates ranging from 0% to 20%- Clearly label the axes, mark reasonable scales on your graph, and explicitly label both r and m coordinates of any important points (c) Note that mi is not defined for r0, but you should be able to think about this situation outside the model. What would m be if r=0? Why? Is this interpretation consistent with what you see int he graph? Did you include this important point properly in your graph? Paying off a loan Suppower your talen ontloan of dollars and pay it back in thly payment Y years, with an interest rate of y. Writing the proper decimal, the monthly payment is a functie of will be m()-P UT 4. Am your loan iP - $20,000 and you pay it back over Y 10 years (a) You should expect that, as the interest rate increases, the monthly payment will (INCREASE 2 DECREASE (Circle one.) (6) Graph the monthly payment function (r) for interest rates ranging from 0 to 20% Clearly label the mark reabile scales on your graph, and explicitly inbel both Tand coordinates of any important points. (c) Note that is not defined for 0, but you should be able to think about this situation outside the model. What would mbeif-07 Why? Is this interpretation consistent with what you see int he graph? Did you include this important polnt properly in your raphy Paying off a loan: Suppose you take out a loan of P dollars and pay it back in monthly payments over Y years, with an antial interest rate of p%. Writing the percentage rate as a decimal, to the monthly payment as a function of r will be m(r) =P B 1-(1.2) 4. Assume your loan is P = $20,000 and you pay it back over Y - 10 years. (a) You should expect that, as the interest rate increases, the monthly payments will INCREASE 7 DECREASE (Circle one.) (b) Graph the monthly payment function m(r) for interest rates ranging from 0% to 20%- Clearly label the axes, mark reasonable scales on your graph, and explicitly label both r and m coordinates of any important points (c) Note that mi is not defined for r0, but you should be able to think about this situation outside the model. What would m be if r=0? Why? Is this interpretation consistent with what you see int he graph? Did you include this important point properly in your graph


